How do you deal with peaks of traffic in Kubernetes?
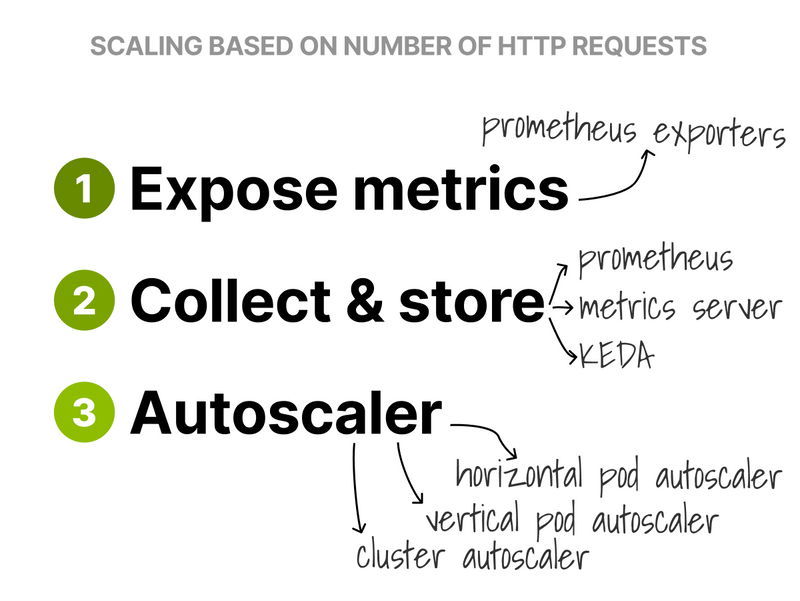
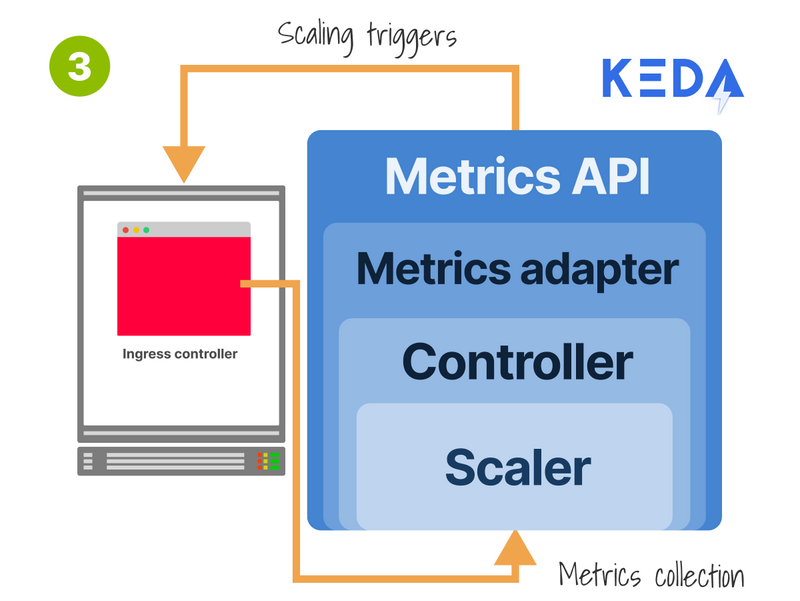
To autoscale the Ingress controller based on incoming requests, you need the following:
- Metrics (e.g. the requests per second).
- A metrics collector (to store the metrics).
- An autoscaler (to act on the data).
Let's start with metrics.
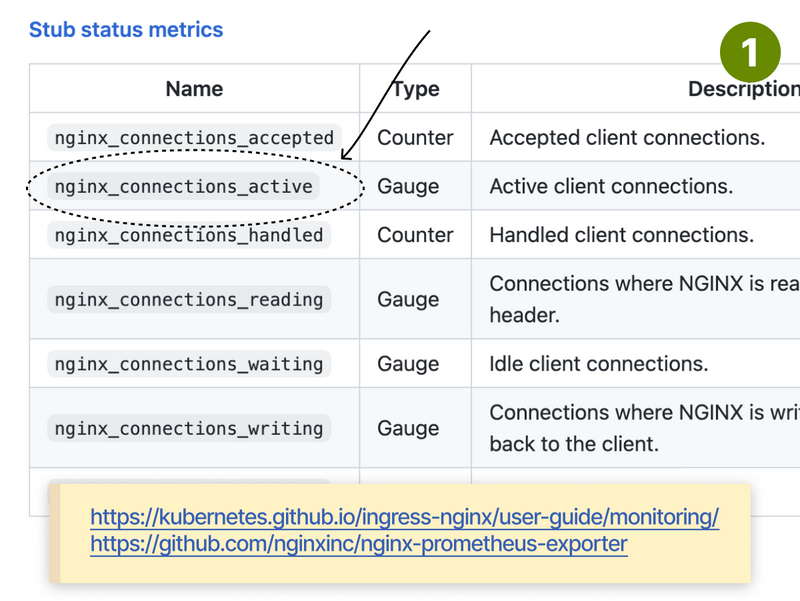
The nginx-ingress can be configured to expose Prometheus metrics.
You can use nginx_connections_active to count the number of active requests.
Next, you need a way to scrape the metrics.
As you've already guessed, you can install Prometheus to do so.
Since Nginx-ingress uses annotations for Prometheus, I installed the server without the Kubernetes operator.
$ helm repo add prometheus-community https://prometheus-community.github.io/helm-charts
"prometheus-community" has been added to your repositories
$ helm install prometheus prometheus-community/prometheus
NAME: prometheus
NAMESPACE: default
STATUS: deployed
REVISION: 1
TEST SUITE: None
I used Locust to generate some traffic to the Ingress to check that everything was running smoothly.
With the Prometheus dashboard open, I checked that the metrics increased as more traffic hit the controller.
The last piece of the puzzle was the autoscaler.
I decided to go with KEDA because:
- It's an autoscaler with a metrics server (so I don't need to install 2 different tools).
- It's easier to configure than the Prometheus adapter.
- I can use the Horizontal Pod Autoscaler with PromQL.
Once I installed KEDA, I only had to create a ScaledObject, configure the source of the metrics (Prometheus), and scale the Pods (with a PromQL query).
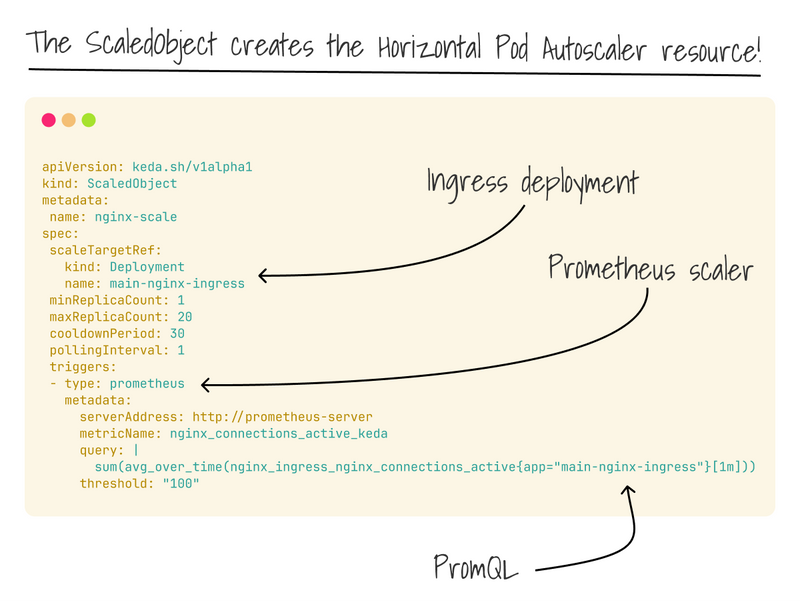
KEDA automatically creates the HPA for me.
I repeated the tests with Locust and watched the replicas increase as more traffic hit the Nginx Ingress controller!

Can this pattern be extended to any other app?
Can you autoscale all microservices on the number of requests received?
Unless they expose the metrics, the answer is no.
However, there's a workaround.
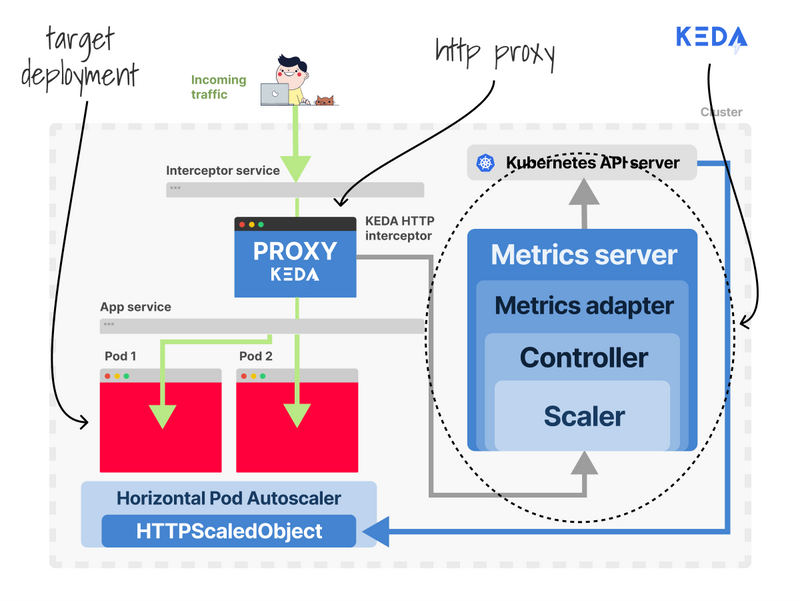
KEDA ships with an HTTP add-on to enable HTTP scaling.
How does it work!?
KEDA injects a sidecar proxy in your pod so that all the HTTP traffic is routed first.
Then it measures the number of requests and exposes the metrics.
With that data at hand, you can trigger the autoscaler finally.
KEDA is not the only option, though.
You could install the Prometheus Adapter.
The metrics will flow from Nginx to Prometheus, and then the Adapter will make them available to Kubernetes.
From there, they are consumed by the Horizontal Pod Autoscaler.
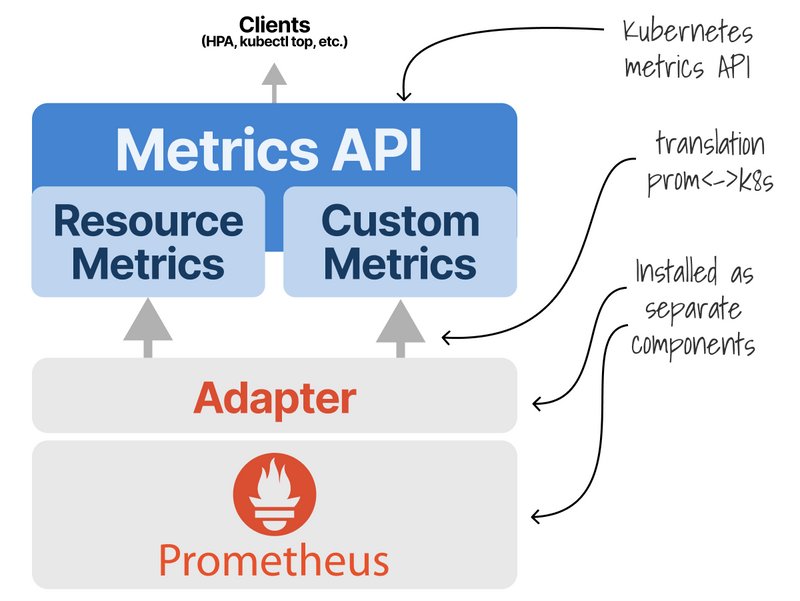
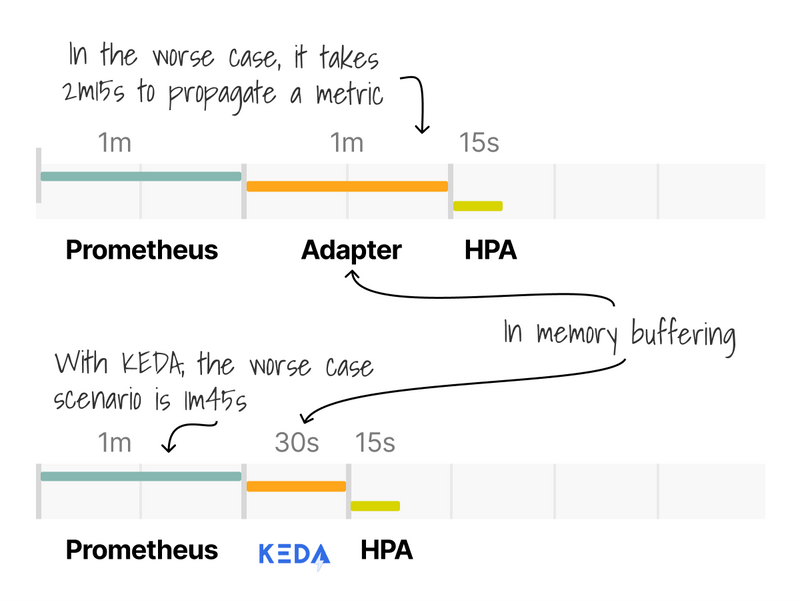
Is this better than KEDA?
They are similar, as both have to query and buffer metrics from Prometheus.
However, KEDA is pluggable, and the Adapter works exclusively with Prometheus.
Is there a competitor to KEDA?
A promising project called the Custom Pod Autoscaler aims to make the pod autoscaler pluggable.
However, the project focuses more on how those pods should be scaled (i.e. algorithm) than the metrics collection.
During my research, I found these links helpful:
- https://keda.sh/docs/2.10/scalers/prometheus/
- https://sysdig.com/blog/kubernetes-hpa-prometheus/
- https://github.com/nginxinc/nginx-prometheus-exporter#exported-metrics
- https://learnk8s.io/scaling-celery-rabbitmq-kubernetes
And finally, if you've enjoyed this thread, you might also like:

Top comments (23)
Autoscaling Ingress Controllers in Kubernetes allows dynamic scaling of Ingress controller instances based on traffic demand, ensuring efficient routing of external traffic to services. By using Horizontal Pod Autoscaler (HPA) and Cluster Autoscaler, Kubernetes can automatically adjust the number of replicas to meet resource needs. This approach helps maintain high availability and optimal performance for services, like those hosted on 104fashionmag.com/ even during fluctuating traffic loads.
These characteristics add to the game's great replay Snow Rider 3D value and widespread appeal, particularly among casual players seeking a fun and short challenge.
This is a solid approach to handling traffic spikes in Kubernetes. Exposing mapquest driving directions Prometheus metrics from the Ingress controller and using them with HPA or KEDA is a smart, scalable solution. Great breakdown! 🚀
Autoscaling Ingress controllers in Kubernetes is a smart way to handle fluctuating traffic efficiently without manual intervention. By automatically adjusting the number of controller pods based on metrics like CPU usage or request rates, your cluster stays responsive during spikes and saves resources when traffic is low. It’s similar to how apps like Magis TV APK scale streaming quality based on your internet speed, ensuring smooth playback without wasting bandwidth. Have you experimented with any specific autoscaling tools or configurations in your Kubernetes setup?
Great post! Autoscaling the Ingress controller is often overlooked, but it’s crucial for handling quordle puzzles traffic spikes efficiently. Exposing Prometheus metrics from nginx-ingress and tying them into an HPA or custom scaler setup makes a big difference. Would love to see a full example with Prometheus + KEDA or HPA in action! 🚀
Great read! I've been wrestling with this exact problem for our staging environment. Using KEDA with Prometheus seems way cleaner than my current janky setup. Definitely going to give this a try next week.mpeg to mp3
Autoscaling Ingress controllers in Kubernetes is such a powerful concept—it’s impressive how it can dynamically adjust to traffic loads and ensure high availability without manual intervention. It really emphasizes the strength of Kubernetes’ orchestration and how modern infrastructure is shifting toward smart, self-managing systems. In a similar way, systems like Tarjeton IMSS automate and streamline access to health services, adapting to users’ needs efficiently. Have you explored how horizontal pod autoscaling or custom metrics can fine-tune your Ingress controller’s performance?
Thank you very much for the excellent information you provide. In the future, I hope you will continue to provide everyone with as many fantastic blogs as possible. fireboy and watergirl
I really liked how the piece explained autoscaling Ingress controllers in Kubernetes, because it’s one of those technical topics that can seem intimidating but makes a huge difference in real-world performance. Having the ability to automatically scale based on traffic spikes not only keeps apps reliable but also optimizes resources so you’re not over-provisioning. It’s almost like playing Serpiente de Google 2025, where you need to react quickly to the changing pace and adjust your strategy on the fly to keep moving forward smoothly. Do you think autoscaling will eventually become the default expectation for all Kubernetes setups rather than something teams have to configure separately?
I really liked how you explained autoscaling Ingress controllers in Kubernetes—it can feel like a very technical topic, but the way you broke it down made the benefits of flexibility and efficiency clear. It’s impressive how autoscaling helps balance traffic loads so apps stay responsive, which feels a bit like how PlayPelis APK manages to deliver smooth streaming even when lots of users are online at once. Do you think autoscaling will eventually become the default setup for most Kubernetes deployments?