Running new apps in Kubernetes is straightforward.
But what happens when you have legacy apps that:
- Log to file instead of stdout?
- Has no support for Prometheus?
- Has no support for HTTPS?
First, let's cover the basics.
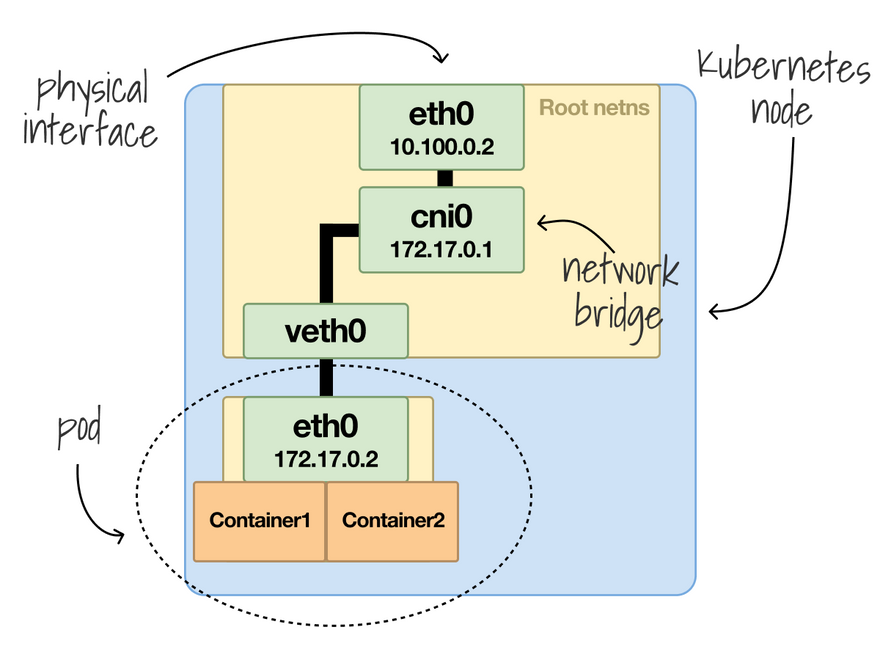
In Kubernetes, a pod is a collection of containers.
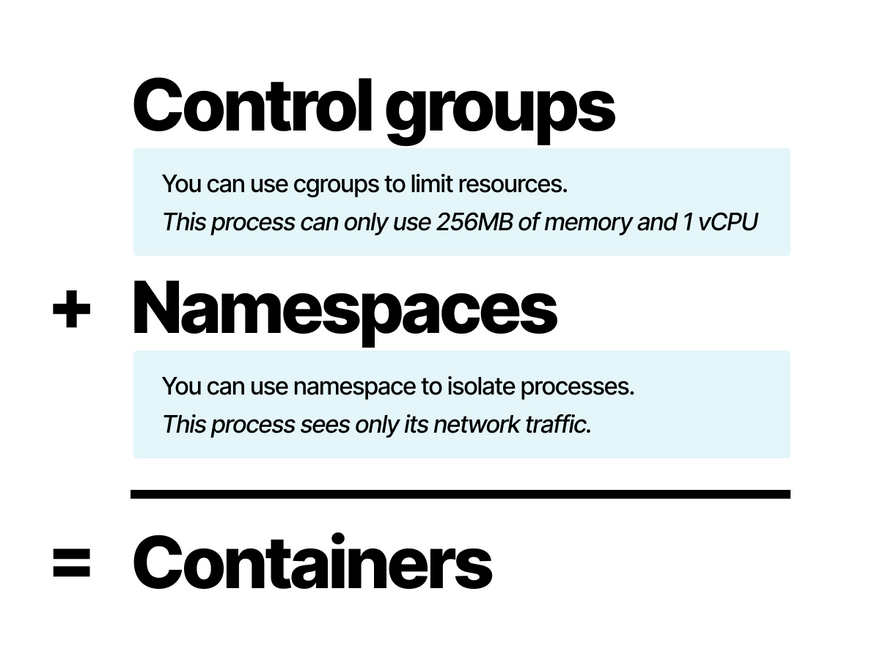
Containers are isolated using two Linux primitives: control groups and namespaces.
- Control groups are for limiting resources (max 256MB of memory).
- Namespaces are for isolation (you can only see this folder).
All the containers in a Pod are isolated except for the network.
The network is shared, and a single IP address is assigned to all containers in a Pod (Pod's IP address).
Why would you need to run more than a container in a Pod?
If you can't (or don't want to) change the code in your app, you might need to adjust its functionality in other ways.
Let's have a look at an example.
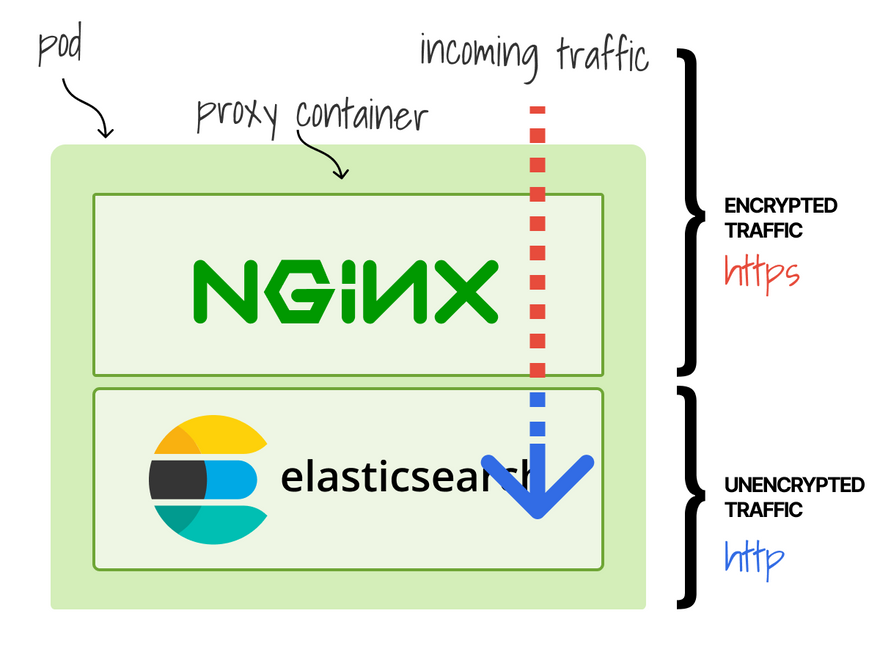
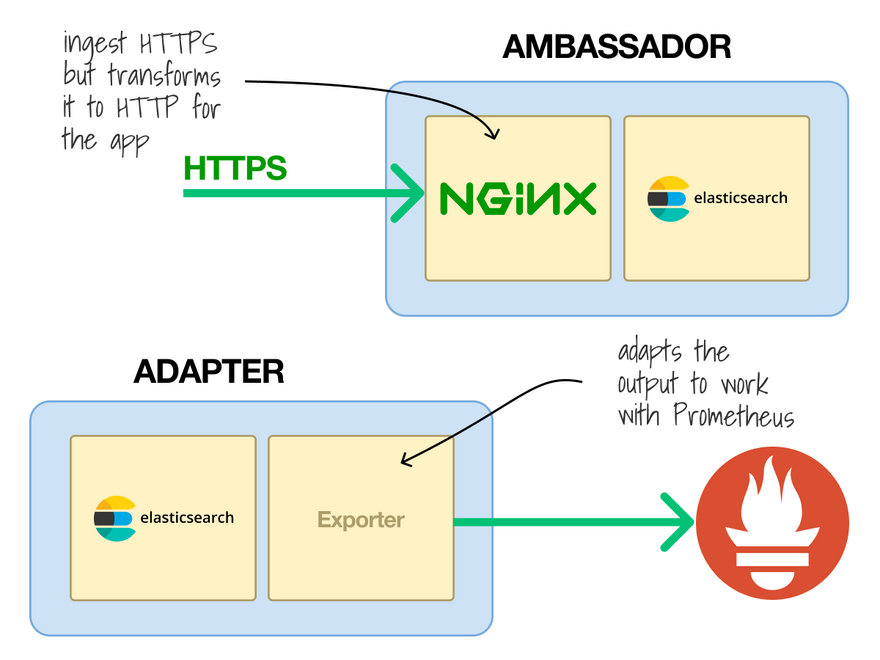
Recent versions of Elasticsearch support TLS, but it was a paid extra feature for a long time.
How did you secure traffic with TLS?
You could add a proxy to your pod as a container.
The (encrypted) traffic reaches the proxy first, then (unencrypted) Elasticsearch.
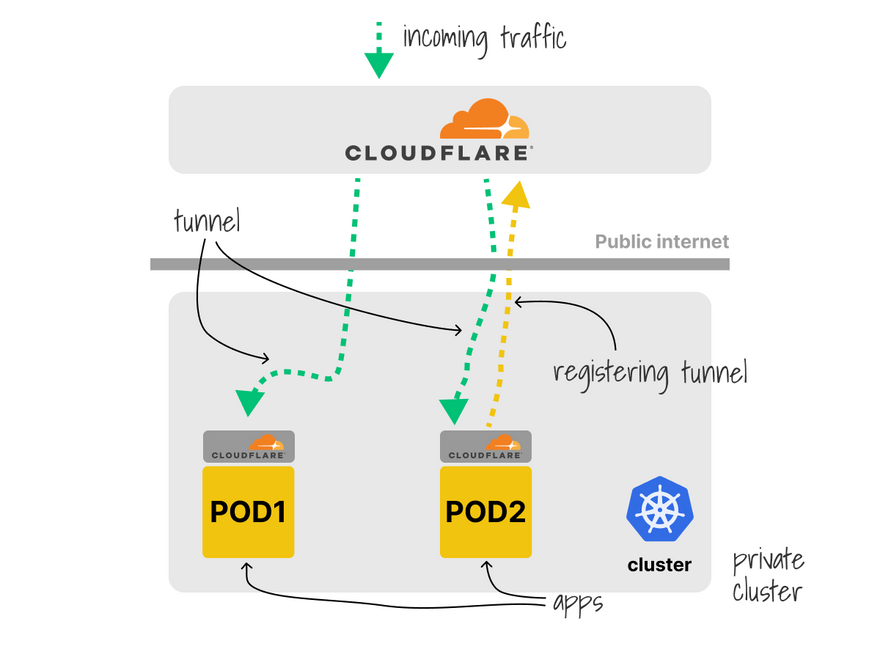
Another example is exposing your apps to the public internet without an Ingress.
Cloudflare tunnel runs an agent alongside the app and proxies all the traffic.
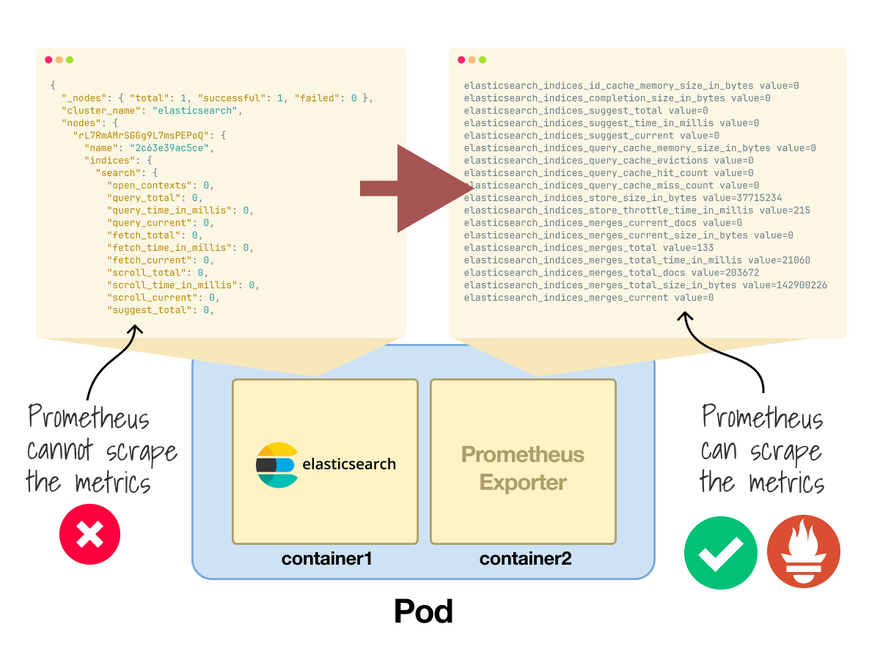
What happens when you want to use Prometheus, but your app has a custom format for exposing metrics?
There's no need to change the code if you use an adapter.
Example: Elasticsearch doesn't expose Prometheus metrics.
Adapter to the rescue!
When you have an extra container in the Pod to handle input, that's called the Ambassador pattern.
If it processes the output of the main container, it's an Adapter instead.
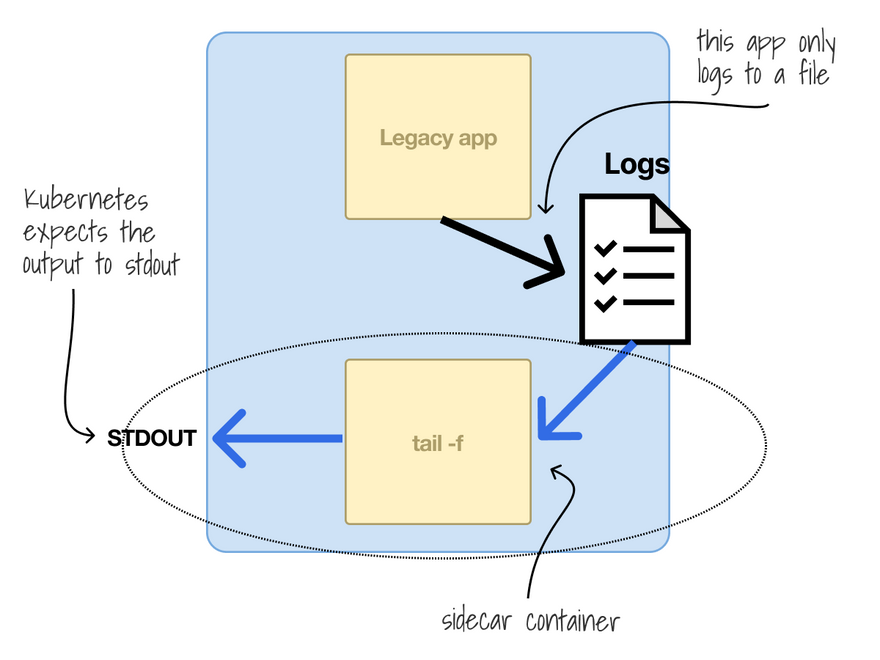
The default for apps in Kubernetes is to print the logs to stdout.
What if you have an app that logs to file instead?
How do you collect the logs?
You can use a container that retrieves the content of the log file and prints it to stdout.
Other sidecars include containers that inject secrets, reload the app when there's a change to ConfigMaps, caching, etc.
Any container that enhances your app is generally called a sidecar container.
Example include:
- Injecting secrets.
- Reloading ConfigMaps when there's a change.
- Caching.
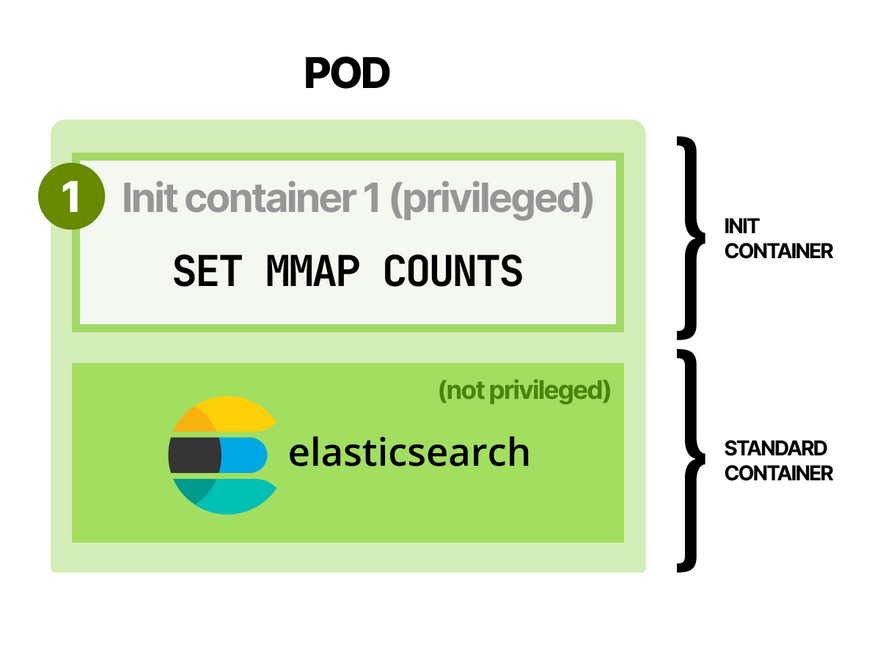
Elasticsearch recommends setting the virtual memory to a higher value (i.e. mmap count) before the app starts.
How do you do that in Kubernetes?
You can use Init Containers, which are containers that run to completion before the "normal" containers start.
So if you're migrating existing apps into Kubernetes, you have four patterns at your disposal:
- Ambassador
- Adapter
- Sidecar
- Init
Those are from the original Google paper.
In this blog post, you can find more in-depth explanations about the multi-container patterns.
And finally, if you've enjoyed this thread, you might also like:
- The Kubernetes workshops that we run at Learnk8s https://learnk8s.io/training
- This collection of past threads https://twitter.com/danielepolencic/status/1298543151901155330
- The Kubernetes newsletter I publish every week, "Learn Kubernetes weekly" https://learnk8s.io/learn-kubernetes-weekly


Latest comments (6)
The rooms all look the same, but you always feel like something is slightly… off. As you wander through identical hallways, humming fluorescent Geometry Dash SubZero lights above you and damp carpet beneath your feet, the oppressive feeling of being watched or followed never leaves.
Hello,
Orca Slicer is a great example of how smart, efficient tools can make complex tasks easier just like container design patterns simplify Kubernetes deployment. Whether it’s slicing 3D models or managing scalable apps, the right setup saves time and delivers reliable results. Go here
This post was a goldmine of useful information! The explanations were spot on, making it a great learning experience.
tut admission status
Kubernetes supports efficient container management through patterns like the Sidecar Pattern, which adds capabilities like logging and monitoring via helper containers, and the Adapter Pattern, which ensures compatibility between services by normalizing data formats. The Ambassador Pattern proxies communication between containers and external services, while the Init Container Pattern handles setup tasks before the main container runs. These design patterns enhance modularity, scalability, and management in Kubernetes.
For more insights, visit nsfasonline-application.co.za/
Hello Daniels. I saw your profile and your posts. I was starting to learn about kubernetes and docker and thought it would be opt to contact you. Can you suggest me a path for learning DevOps along with Kubernetes and Docker
github.com/MichaelCade/90DaysOfDevOps