VictoriaLogs is a relatively new system for collecting and analyzing logs, similar to Grafana Loki, but — like VictoriaMetrics compared to vanilla Prometheus — less demanding on CPU/Memory resources.
Personally, I’ve been using Grafana Loki for about 5 years, but sometimes I have concerns about it — both in terms of documentation and the overall complexity of the system, because there are many components. Also, there are questions about it in terms of performance, because no matter how I’ve tried to tune it (see Grafana Loki: performance optimization with Recording Rules, caching, and parallel queries), but still sometimes on relatively small queries Grafana returns 504 errors from the Loki Gateway, and I’m honestly tired of dealing with it.
So, since monitoring in my project is built on VictoriaMetrics, and VictoriaLogs has already got the Grafana data source support, it’s time to try it out and compare it with Grafana Loki.
To start with, keep in mind that VictoriaLogs is still in the Beats state, and doesn’t have yet:
- no support for AWS S3 backend — but they promise to do it in November 2024 (with some “magic” automation — when old data from the local disk will be automatically moved to the corresponding S3)
- there is no analog of Loki RecordingRules yet — when we create regular metrics from logs, then push them to VictoriaMetrics/Prometheus, and then make alerts in VMAlert and/or dashboards in Grafana, but again, it should be soon — October-November 2024
- Grafana data source is also still in Beta, so there are difficulties with graphing in Grafana
And there is a problem with all kinds of ChatGPTs for generating queries — but we’ll talk about that later.
VictoriaLogs documentation — as always in VictoriaMetrics — has excellent documentation.
There are some updates about the VictoriaLogs at the VictoriaMetrics Meetup June 2024 — VictoriaLogs Update.
Interesting screenshots with benchmarks VictoriaLogs vs ELK vs Grafana Loki — Benchmark for VictoriaLogs.
Roadmap for VictoriaLogs — here>>>.
So what are we going to do today?
- launch VictoriaLogs in Kubernetes
- take a look at the capabilities of its LogsQL
- connect the Grafana data source
- will see how to create a dashboard in Grafana
VictoriaLogs Helm chart
We’ll deploy from the vm/victoria-logs-single Helm-chart.
VictoriaLogs is also supported in VictoriaMetrics Operator (see VLogs).
On my project, we use our own chart for our monitoring (seeVictoriaMetrics: deploying a Kubernetes monitoring stack), in which the victoria-metrics-k8s-stack chart + all some additional services like Promtail, k8s-event-logger, etc. are installed through the Helm dependency. Let’s add victoria-logs-single to the same chart.
To begin with, we’ll do everything manually, first with some default values, then we’ll see what it will install in Kubernetes and how it works, and then we’ll add it to the automation.
In the VictoriaLogs chart, there is an option to run Fluetbit DaemonSet, but we already have Promtail, so we will use it.
All values are available in the chart documentation, but here's what might be interesting now:
-
extraVolumeMountsandextraVolumes: we can create our own dedicatedpersistentVolumewith AWS EBS and connect it to VictoriaLogs to store our logs -
persistentVolume.enabledandpersistentVolume.storageClassName: or we can simply specify that it should be created, and if necessary, set our ownstorageClasswith the ReclaimPolicyretain -
ingress: in my case, some of the logs are written with AWS Lambda (for example, see Grafana Loki: collecting AWS LoadBalancer logs from S3 with Promtail Lambda), so will need to create an AWS ALB with the Internal type
Installing the chart
Add a repository:
$ helm repo add vm https://victoriametrics.github.io/helm-charts/
$ helm repo update
Install the chart in a separate Kubernetes Namespace ops-test-vmlogs-ns:
$ helm -n ops-test-vmlogs-ns upgrade --install vlsingle vm/victoria-logs-single
Check Kubernetes Pod there:
$ kk get pod
NAME READY STATUS RESTARTS AGE
vlsingle-victoria-logs-single-server-0 1/1 Running 0 36s
And let’s look at the resources used by the Pod:
$ kk top pod
NAME CPU(cores) MEMORY(bytes)
vlsingle-victoria-logs-single-server-0 1m 3Mi
3 megabytes of memory :-)
Looking ahead, after connecting logs from Promtail to VictoriaLogs, it will not use much more resources.
Let’s open access to the VM UI:
$ kk -n ops-test-vmlogs-ns port-forward svc/vlsingle-victoria-logs-single-server 9428
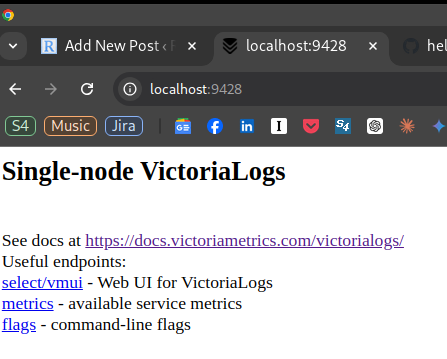
In a browser, go to the http://localhost:9428.
As with other services from VictoriaMetrics, you will be taken to a page with all the necessary links:
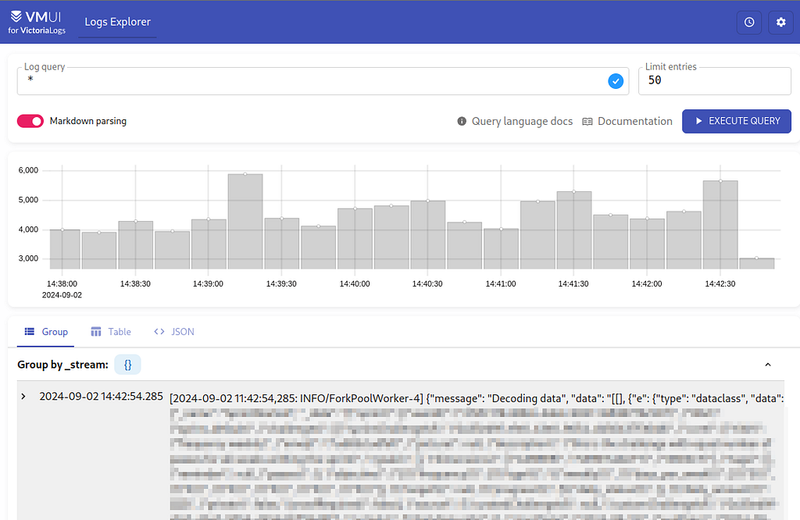
Let’s go to http://localhost:9428/select/vmui/ — it’s empty yet:
Let’s add sending logs from Promtail.
Configuring Promtail
You can write logs to VictoriaLogs in Elasticsearch, ndjson, or Loki format — see Data ingestion.
We are actually interested in Loki, and we write logs with Promtail. For an example of Promtail configuration for VictoriaLogs, see Promtail setup.
In our case, Promtail is installed from its own chart, and it creates a Kubernetes Secret with the promtail.yml config file.
Update the chart values, add another URL to config.clients - in my case, it will be with the namespace ops-test-vmlogs-ns.svc, because VictoriaLogs is running in a different namespace than Loki:
...
promtail:
  config:
    clients:
      - url: http://atlas-victoriametrics-loki-gateway/loki/api/v1/push
      - url: http://vlsingle-victoria-logs-single-server.ops-test-vmlogs-ns.svc:9428/insert/loki/api/v1/push
...
Deploy the changes, wait for the restart of the pods from Promtail, and check the logs in VictoriaLogs again:
VictoriaLogs Log Streams
When writing logs to VictoriaLogs, we can set additional parameters — see HTTP parameters.
One of the things that may be interesting now is to try to create your own Log Streams to filter logs for faster processing.
If a log stream is not specified, then VictoriaLogs writes everything to one default stream {}, as we saw on the screenshot above.
For example, in our cluster all applications are divided into their own Kubernetes Namespaces — dev-backend-api-ns, prod-backend-api-ns, ops-monitoring-ns, etc.
Let’s create a separate stream for each namespace — add ?_stream_fields=namespace to the url:
...
  config:
    clients:
      - url: http://atlas-victoriametrics-loki-gateway/loki/api/v1/push
      - url: http://vlsingle-victoria-logs-single-server.ops-test-vmlogs-ns.svc:9428/insert/loki/api/v1/push?_stream_fields=namespace
...
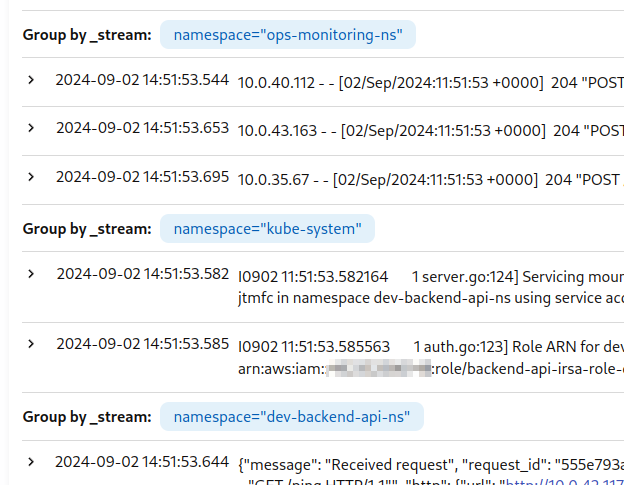
Deploy it, and now we have separate streams for each Namespace:
VictoriaLogs vs Loki: CPU/Memory resources
Let’s just take a look at the resources that all the Pods for Loki are currently consuming:
$ kk -n ops-monitoring-ns top pod | grep loki
atlas-victoriametrics-loki-chunks-cache-0 2m 824Mi
atlas-victoriametrics-loki-gateway-6bd7d496f5-9c2fh 1m 12Mi
atlas-victoriametrics-loki-results-cache-0 1m 32Mi
loki-backend-0 50m 202Mi
loki-backend-1 8m 214Mi
loki-backend-2 12m 248Mi
loki-canary-gzjxh 1m 15Mi
loki-canary-h9d6s 1m 17Mi
loki-canary-hkh4f 2m 17Mi
loki-canary-nh9mf 2m 16Mi
loki-canary-pbs4x 1m 17Mi
loki-read-55bcffc9fb-7j4tg 12m 255Mi
loki-read-55bcffc9fb-7qtns 45m 248Mi
loki-read-55bcffc9fb-s7rpq 10m 244Mi
loki-write-0 42m 262Mi
loki-write-1 27m 261Mi
loki-write-2 26m 258Mi
And VictoriaLogs resources:
$ kk top pod
NAME CPU(cores) MEMORY(bytes)
vlsingle-victoria-logs-single-server-0 2m 14Mi
Although the same number of logs are written.
Yes, Loki now has a bunch of RecordingRules, yes, there are a couple of dashboards in Grafana that make requests directly to Loki for graphs, but the difference is huge!
Perhaps it’s also my crooked hands that couldn’t tune Loki properly — but VictoriaLogs is now running without any tweaking at all.
LogsQL
Okay — we have the VictoriaLogs instance, we have the logs that are written to it.
Let’s try to query some data from the logs, take on overview of the LogsQL in general, and compare it a bit with Loki’s LogQL.
The LogsQL documentation for VictoriaLogs is here>>>.
We can make queries from the VM UI, from the CLI, and from Grafana — see Querying.
Querying with the HTTP API
VictoriaLogs has a very nice API that can be used to get all the data you need.
For example, to search the logs using curl, we can make a query to the /select/logsql/query endpoint, and then pass it to jq via UNIX pipe.
We still have running kubectl port-forward, so let's make a query searching for all logs with the word_"error"_:
$ curl -s localhost:9428/select/logsql/query -d 'query=error' | head | jq
{
  "_time": "2024-09-02T12:23:40.890465823Z",
  "_stream_id": "0000000000000000195443555522d86dcbf56363e06426e2",
  "_stream": "{namespace=\"staging-backend-api-ns\"}",
  "_msg": "[2024-09-02 12:23:40,890: WARNING/ForkPoolWorker-6] {\"message\": \"Could not execute transaction\", \"error\": \"TransactionCanceledException('An error occurred (TransactionCanceledException) when calling the TransactWriteItems operation: Transaction cancelled, please refer cancellation reasons for specific reasons [None, None, ConditionalCheckFailed]')\", \"logger\": \"core.storage.engines.dynamodb_transactions\", \"level\": \"warning\", \"lineno\": 124, \"func_name\": \"_commit_transaction\", \"filename\": \"dynamodb_transactions.py\", \"pid\": 2660, \"timestamp\": \"2024-09-02T12:23:40.890294\"}",
  "app": "backend-celery-workers",
  "component": "backend",
  "container": "backend-celery-workers-container",
  "filename": "/var/log/pods/staging-backend-api-ns_backend-celery-workers-deployment-66b879bfcc-8pw52_46eaf32d-8956-4d44-8914-7f2afeda41ad/backend-celery-workers-container/0.log",
  "hostname": "ip-10-0-42-56.ec2.internal",
  "job": "staging-backend-api-ns/backend-celery-workers",
  "logtype": "kubernetes",
  "namespace": "staging-backend-api-ns",
  "node_name": "ip-10-0-42-56.ec2.internal",
  "pod": "backend-celery-workers-deployment-66b879bfcc-8pw52",
  "stream": "stderr"
}
...
And as a result, we have all the fields and the Log Stream that we set above — by the Namespace field.
Another interesting endpoint is the ability to get all the streams with a keyword in the logs, for example:
$ curl -s localhost:9428/select/logsql/streams -d "query=error" | jq
{
  "values": [
    {
      "value": "{namespace=\"ops-monitoring-ns\"}",
      "hits": 5012
    },
    {
      "value": "{namespace=\"staging-backend-api-ns\"}",
      "hits": 542
    },
...
Queries from the VM UI
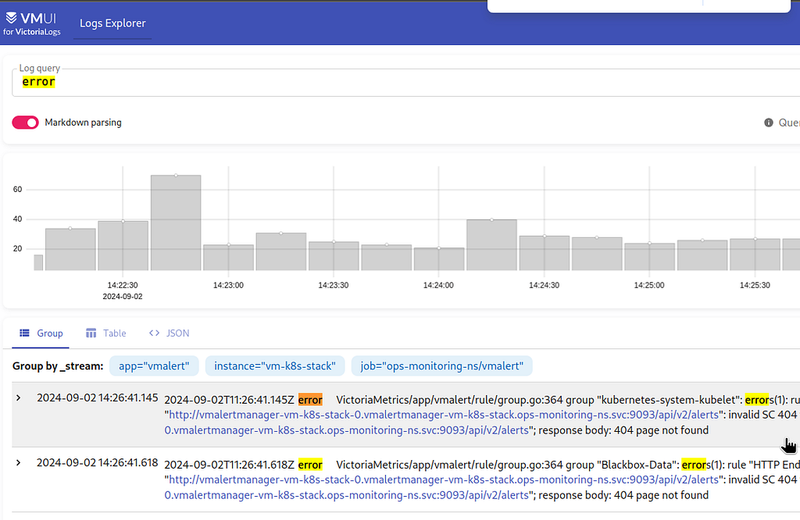
Everything is simple here: write a query in the Log query field, and get the result.
You can get the result in Group by, Table, and JSON formats. The JSON we have already seen it in the HTTP API.
In the Group by format, the result is displayed for each stream:
And in Table format — in columns by field names from the logs:
LogsQL basic syntax
In general, there are plenty of possibilities — see all of them in the LogsQL documentation.
But let’s take a look for at least the main ones to get an idea of what we can do.
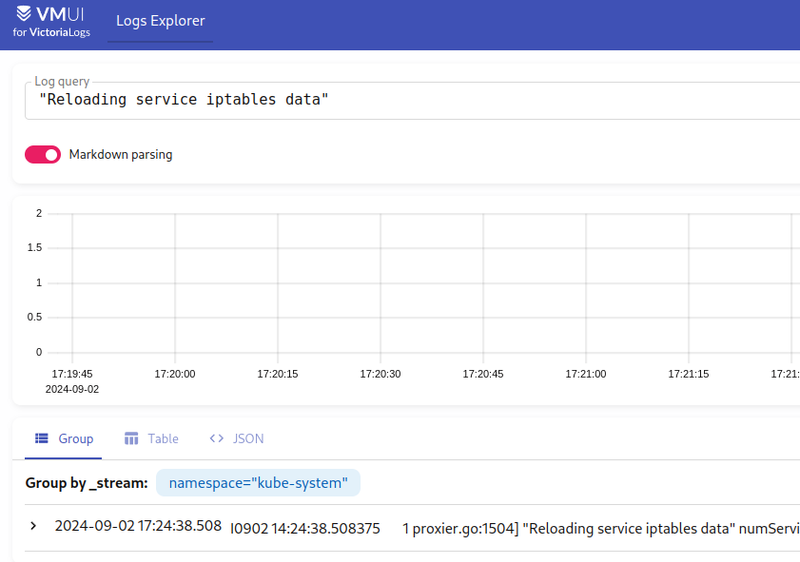
We’ve already seen the simplest example of LogsQL queries — just by the word_”error”_.
To search for a phrase, wrap it in quotation marks:
Results sorting
An important caveat is that the results are returned in random order to improve the performance, so it is recommended to use the pipe sort by the _time field:
_time:5m error | sort by (_time)
Comments
It’s really cool that we can add comments to requests, for example:
_time:5m | app:="backend-api" AND namespace:="prod-backend-api-ns" # this is a comment
| unpack_json | keep path, duration, _msg, _time # and an another one comment
| stats by(path) avg(duration) avg_duration | path:!"" | limit 10
Operators
In LogsQL, they are called Logical filters — AND, OR, NOT.
For example, we can use AND in the following way: we are looking for a record that contains the string_"Received request"_ and the ID_"dada85f9246d4e788205ee1670cfbc6f_":
"Received request" AND "dada85f9246d4e788205ee1670cfbc6f"
Or search for “Received request” only from the namespace="prod-backend-api-ns" stream:
"Received request" AND _stream:{namespace="prod-backend-api-ns"}
Or by the pod field:
"Received request" AND pod:="backend-api-deployment-98fcb6bcb-w9j26"
By the way, the AND operator can be omitted, so the query:
"Received request" pod:="backend-api-deployment-98fcb6bcb-w9j26"
Will be processed in the same way as the previous one.
But in the examples below, I will still add AND for clarity.
Filters
Any LogsQL query must contain at least one filter.
When we make a query like_”Received request”_, we actually use the Phrase filter, which is applied to the _msg field by default.
And in the _stream:{namespace="prod-backend-api-ns"} request, we use the Stream filter.
Other interesting filters:
- Time filter — you can set the time period in minutes/hours or dates
- Day та Week range filter — or search by specific dates or days of the week
- Prefix filter — search for an incomplete word or phrase
- Case-insensitive filter — well, the case-insensitive search
- Regexp filter — regular expressions in the search
- IPv4 range filter — awesome feature — a ready-made filter for IP addresses
Let’s take a quick look at a few examples.
Time filter
Select all last-minute entries:
"Received request" AND _time:1m
Or for the September 1, 2024:
"Received request" AND _time:2024-09-01
Or for the period from August 30 to September 2 inclusive:
"Received request" AND _time:[2024-08-30, 2024-09-02]
Or without entries for 2024–08–30 — that is, starting from the 31st — change [ to (:
"Received request" AND _time:(2024-08-30, 2024-09-02]
Day range filter
Filters by hours of the day.
For example, all records between 14:00 and 18:00 today:
"Received request" AND _time:day_range[14:00, 18:00]
Similar to Time filter — use () and [] to include or exclude the beginning or end of the range.
Week range filter
Similar to the Day range filter, but by day of the week:
"Received request" AND _time:week_range[Mon, Fri]
Prefix filter
Use"*" to indicate that we need all logs that start with the phrase_"ForkPoolWorker-1"_- that is, all worker numbers 1, 12, 19, etc:
"ForkPoolWorker-1"*
Similarly, we can use this filter for values in record fields.
For example, select all records where the container field has the value_"backend-celery"_:
app:"backend-celery-"*
Or you can use Substring filter:
app:~"backend-celery"
Regexp filter
Regular expression search can also be combined with Substring filter.
For example, find all records with_”Received request”_ OR_”ForkPoolWorker”_:
~"Received request|ForkPoolWorker"
Pipes
Another interesting feature in LogsQL is the use of pipes through which you can perform additional operations.
For example, in Grafana, I often needed to rename a field name from a metric or log.
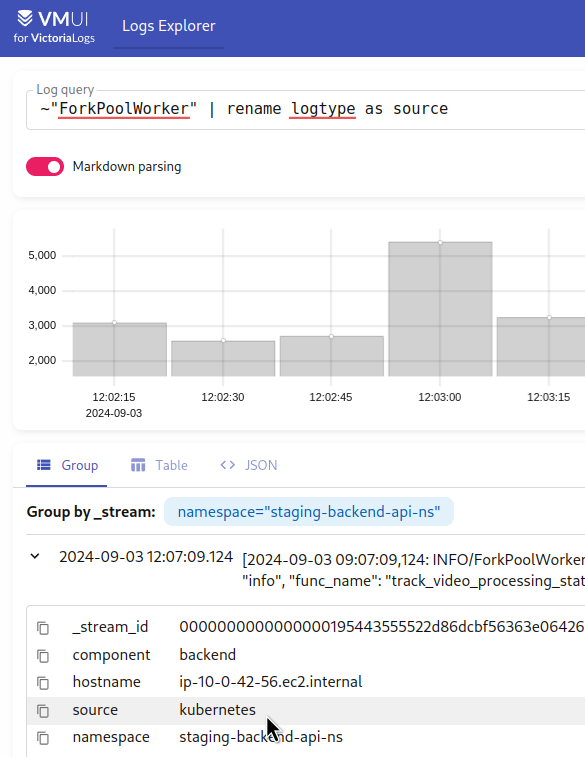
With LogsQL, this can be done with | copy or | rename:
- there is a field
logtype: kubernetes - we want to make it
source: kubernetes
Run the following query:
~"ForkPoolWorker" | rename logtype as source
And check fields in the result:
Other interesting pipes:
-
deletepipe: remove a field from the results -
extractpipe: create a new field with a value from the logs -
field_namespipe: return all fields with a number of records -
fieldspipe: return only selected fields in the results -
filterpipe: filter results with additional conditions -
limitpipe: display only the specified number of results (see also top) -
mathpipe: perform math operations -
offsetpipe: also a cool thing - make an "offset" by a specified time period -
pack_jsonpipe: "pack" all fields from the results into JSON (see alsopack_logfmtandunpack_json) -
replacepipe: replace a word/phrase in the results with another (e.g. mask passwords) -
sortpipe: sorting operations in the results -
statspipe: display statistics
I’m not going to describe the examples here, because they are generally available in the documentation, but let’s take a look at an example query for Loki and try to rewrite it for VictoriaLogs, and there we will try pipes in action.
An example: Loki to VictoriaLogs query
We have such a query for Loki RecordingRules:
- record: eks:pod:backend:api:path_duration:avg
  expr: |
    topk (10,
        avg_over_time (
            {app="backend-api"} | json | regexp "https?://(?P<domain>([^/]+))" | line_format "{{.path}}: {{.duration}}" | unwrap duration [5m]
        ) by (domain, path, node_name)
    )
From the Kubernetes Pods logs from our Backend API Pods, the Rule creates the eks:pod:backend:api:path_duration:avg metric, which displays the average response time by each endpoint.
Here we have:
- select logs from the
app="backend-api"log stream - logs are written in JSON, so we use the
jsonparser - then with the
regexparser, we create adomainfield with a value after_"https://"_ - with the
line_formatwe getpathanddurationfields - use
unwrapto "extract" the value fromduration - calculate the average value from duration using the
avg_over_time()operator for the last 5 minutes, grouping bydomain,path,node_namefields - they are then used in Grafana alerts and graphs - collect information on the top 10 records
How can we do something similar with VictoriaLogs and its LogsQL?
Let’s start with a field filter:
app:="backend-api"
Here we get all the records from the Backend API application.
Remember that we can use a regular expression here and set the filter as app:~"backend" - then we'll get results with app="backend-celery-workers", app="backend-api ", etc.
You can add a filter by stream — only from production:
_stream:{namespace="prod-backend-api-ns"} AND app:="backend-api"
Or just:
namespace:="prod-backend-api-ns" AND app:="backend-api"
In our Loki metrics, we don’t use the namespace filed because the filters in alerts and Grafana use the domain name from the domain field, but here let's add for the example and clarity.
Next, we need to create the domain, path, and duration fields.
Here, we can use either unpack_json or extract.
The unpack_json will parse the JSON and create record fields from each key in the JSON:
- the documentation for the
unpack_jsonsays that it is better to use theextractpipe - if use it, the request would be
| extract '"duration": <duration>,'
But we don’t need all the fields, so we can drop them all and leave only duration, _msg, and _time with the keep filter:
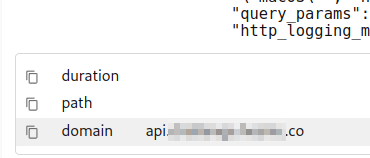
Next, we need to create the domain field. But simply taking the url key created by unpack_json from the {"url": "http://api.app.example.co/coach/notifications?limit=0" ...}doesn't work for us, because we only need the domain - without the "/coach/notifications_?limit=0_" URI.
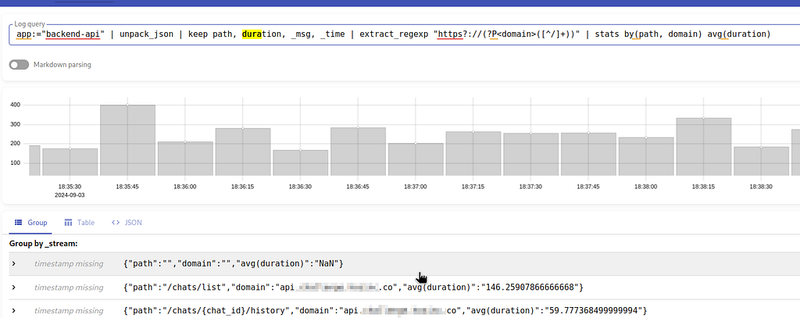
To solve this, we can add the extract_regexp filter - extract_regexp "https?://(?P<domain>([^/]+))":
Now that we have all three fields, we can use stats by() and avg by the duration field:
And to remove the {"path":"", "domain":"", "avg(duration)": "NaN"} from the results, add the path:!"" filter.
Now the entire query will be:
app:="backend-api" | unpack_json | keep path, duration, _msg, _time | extract_regexp "https?://(?P<domain>([^/]+))" | stats by(path, domain) avg(duration) | path:!""
Lastly, we add the limit for the last 5 minutes — _time:5m, and display only the top 10 results.
I’ll remove the domain here and add a namespace filter to make it easier to compare with the results in Loki.
We will write the result of the avg(duration) to the new field avg_duration.
Now the entire query will be like this:
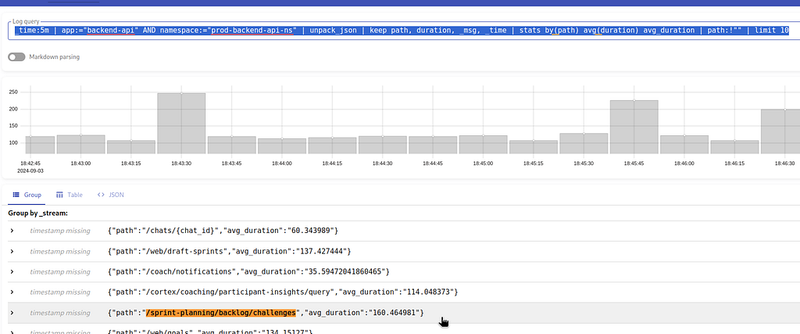
_time:5m | app:="backend-api" AND namespace:="prod-backend-api-ns" | unpack_json | keep path, duration, _msg, _time | stats by(path) avg(duration) avg_duration | path:!"" | limit 10
And the result is:
Instead of the limit, you can use the top pipe - because limit simply limits the number of requests, and top limits it by the value of the field:
_time:5m | app:="backend-api" AND namespace:="prod-backend-api-ns" | unpack_json | keep path, duration, _msg, _time | stats by(path) avg(duration) avg_duration | path:!"" | top 10 by (path, duration)
And we can add sort(), and put the path:!"" condition before calling stats() to make the request processing faster:
_time:5m | app:="backend-api" AND namespace:="prod-backend-api-ns" | unpack_json | keep path, duration, _msg, _time | path:!"" | stats by(path) avg(duration) avg_duration | sort by (_time, avg_duration) | top 10 by (path, avg_duration)
Let’s compare it with the result from Loki, for example, the API endpoint /sprint-planning/backlog/challenges in the VictoriaLogs results has a value of 160.464981 milliseconds.
Run a similar query in Loki:
topk (10,
    avg_over_time (
        {app="backend-api", namespace="prod-backend-api-ns"} | __error__ ="" | json | line_format "{{.path}}: {{.duration}}" | unwrap duration [5m]
    ) by (path)
)
Looks good.
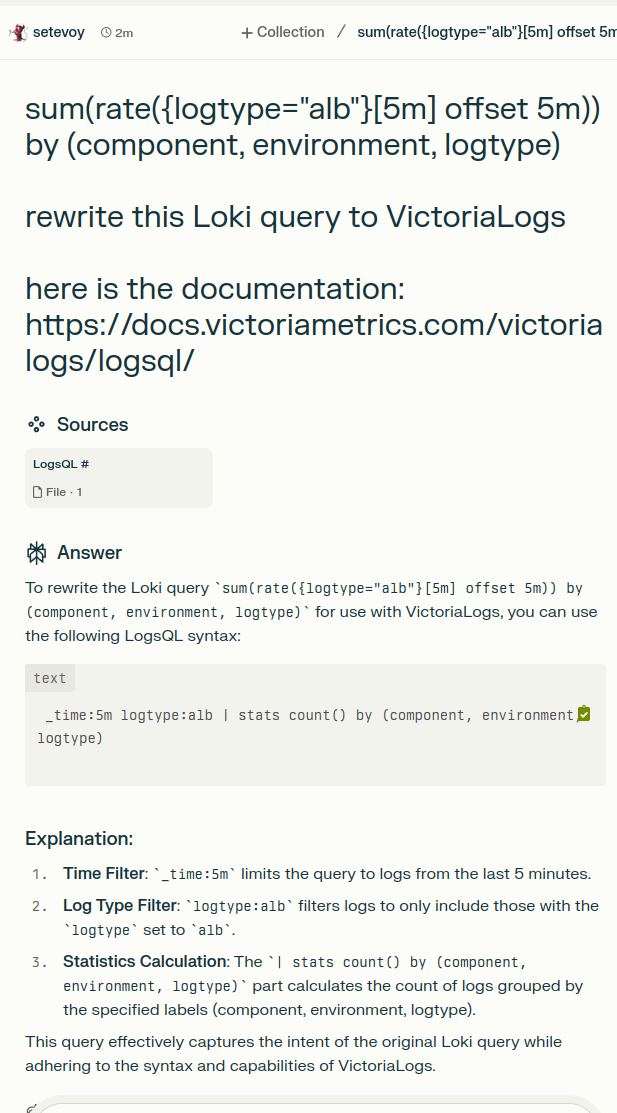
ChatGPT, Gemini, Claude, and LogsQL (but Perplexity!)
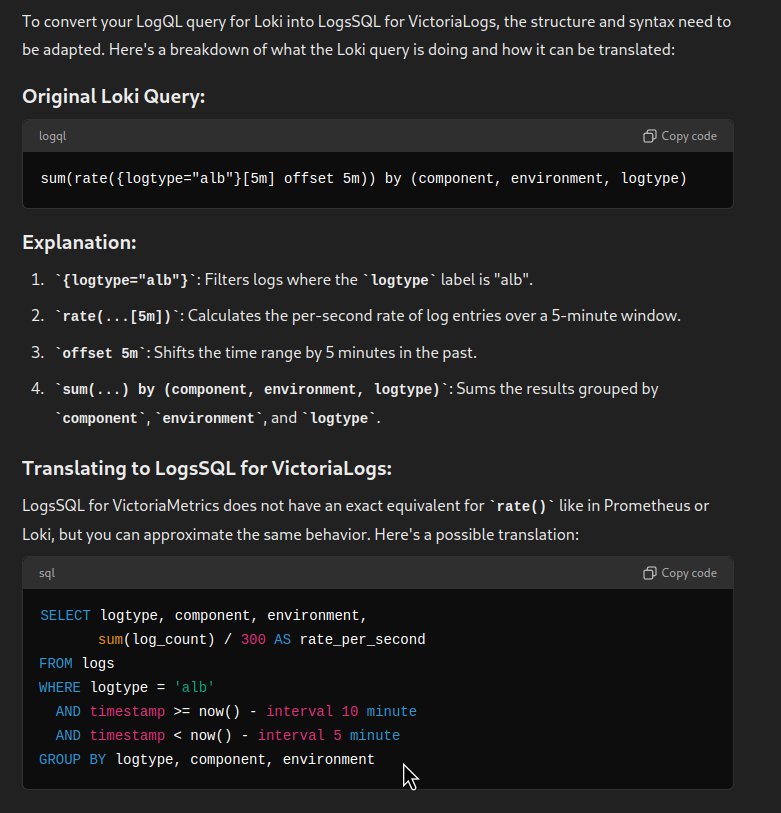
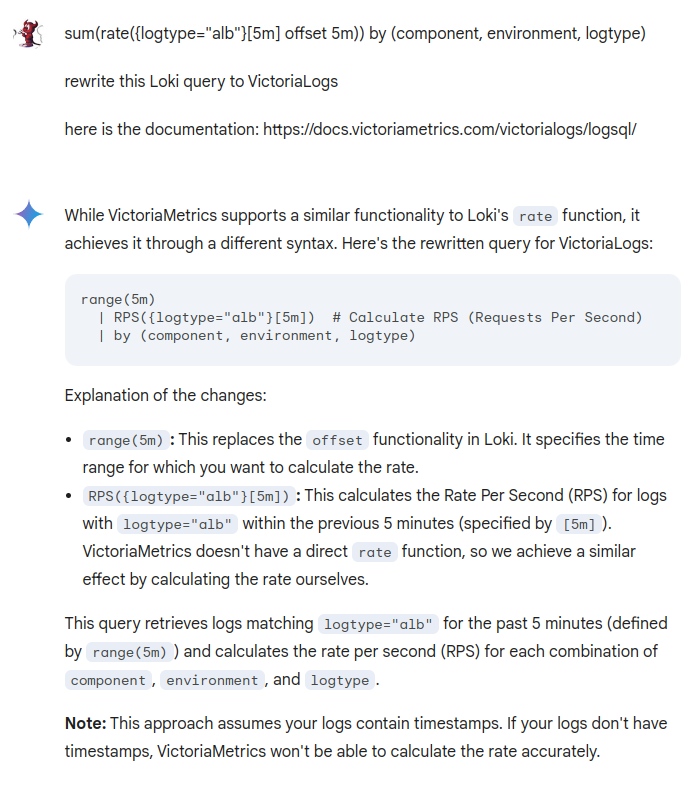
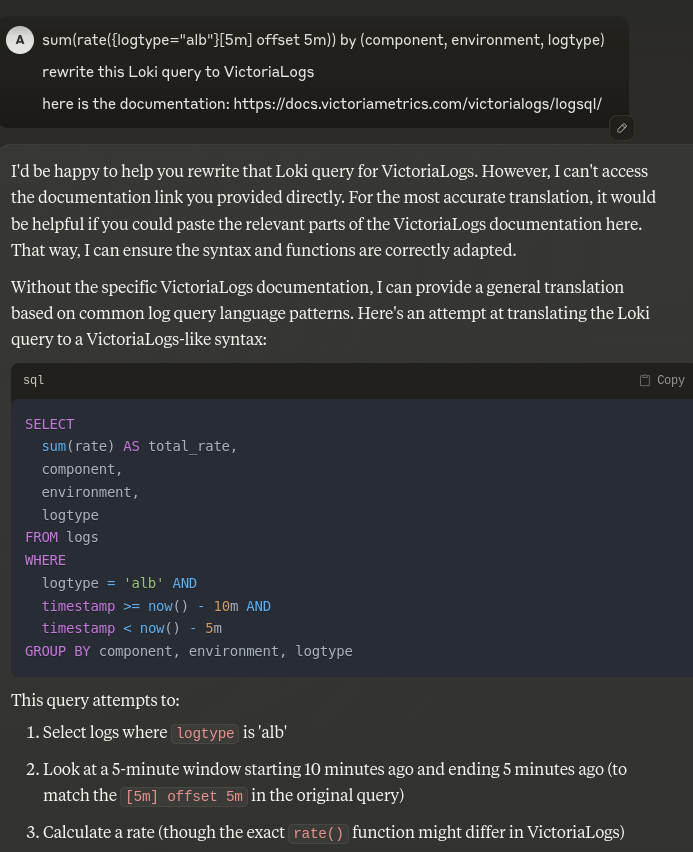
I tried to rewrite queries from Loki LogQL to VictoriaMetrics LogsQL with chatbots, and it was very disappointing.
ChatGPT is really hallucinating, and produces statements like SELECT that don't exist at all:
Gemini is a little better, at least with more or less real operators, but it’s still not a case where you can just copy and use:
And Claude, similarly to ChatGPT, knows nothing, but offers “something similar”:
But Perplexity answered almost correctly:
I just got the order wrong — by() should be after stats().
Helm, VictoriaLogs, and Grafana data source
The repository and documentation — victorialogs-datasource.
VictoriaLogs sub-chart installation
Let’s add VictoriaLogs with Helm.
Just to remind you that in my current project we have the entire monitoring stack installed from our own chart, in which victoria-metrics-k8s-stack, k8s-event-logger, aws-xray, etc are added through the Helm dependency.
Remove the manually installed chart:
$ helm -n ops-test-vmlogs-ns uninstall vlsingle
In the Chart.yaml file, add another dependency:
apiVersion: v2
name: atlas-victoriametrics
description: A Helm chart for Atlas Victoria Metrics kubernetes monitoring stack
type: application
version: 0.1.1
appVersion: "1.17.0"
dependencies:
- name: victoria-metrics-k8s-stack
  version: ~0.25.0
  repository: https://victoriametrics.github.io/helm-charts
- name: victoria-metrics-auth
  version: ~0.6.0
  repository: https://victoriametrics.github.io/helm-charts
- name: victoria-logs-single
  version: ~0.6.0
  repository: https://victoriametrics.github.io/helm-charts
...
Update subcharts:
$ helm dependency build
Update our values — add a permanent storage:
...
victoria-logs-single:
  server:
    persistentVolume:
      enabled: true
      storageClassName: gp2-retain
      size: 3Gi # default value, to update later
...
Deploy it and check the Service name for VictoriaLogs:
$ kk get svc | grep logs
atlas-victoriametrics-victoria-logs-single-server ClusterIP None <none> 9428/TCP 2m32s
Edit the Promtail configuration — set a new URL:
...
promtail:
  config:
    clients:
      - url: http://atlas-victoriametrics-loki-gateway/loki/api/v1/push
      - url: http://atlas-victoriametrics-victoria-logs-single-server:9428/insert/loki/api/v1/push?_stream_fields=namespace
...
Connecting the Grafana data source
I had to tinker a bit with the values for Grafana, but eventually, it turned out like this:
...
  grafana:
    enabled: true

    env:
      GF_PLUGINS_ALLOW_LOADING_UNSIGNED_PLUGINS: "victorialogs-datasource"
    ...
    plugins:
      - grafana-sentry-datasource
      - grafana-clock-panel
      - grafana-redshift-datasource
      - https://github.com/VictoriaMetrics/victorialogs-datasource/releases/download/v0.4.0/victorialogs-datasource-v0.4.0.zip;victorialogs-datasource
    additionalDataSources:
      - name: Loki
        type: loki
        access: proxy
        url: http://atlas-victoriametrics-loki-gateway:80
        jsonData:
          maxLines: 1000
          timeout: 3m
      - name: VictoriaLogs
        type: victorialogs-datasource
        access: proxy
        url: http://atlas-victoriametrics-victoria-logs-single-server:9428
Look for the versions on the Releases page, the latest one is v0.4.0.
And note that the version is specified twice in the URL — /releases/download/v0.4.0/victorialogs-datasource-v0.4.0.zip.
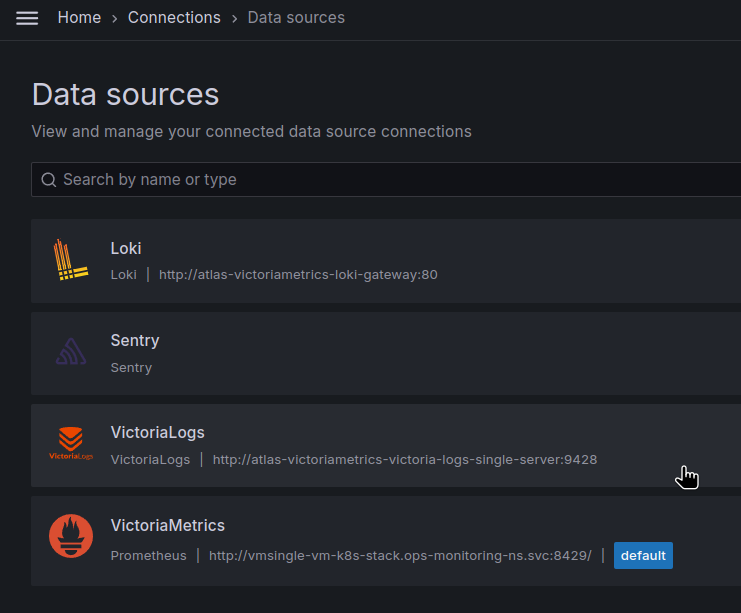
Deploy it, restart Grafana Pods if necessary (unless you use something like Reloader), and check the data sources:
Let’s try it with the Grafana Explore:
“It works!” ©
Grafana dashboards and Time series visualization
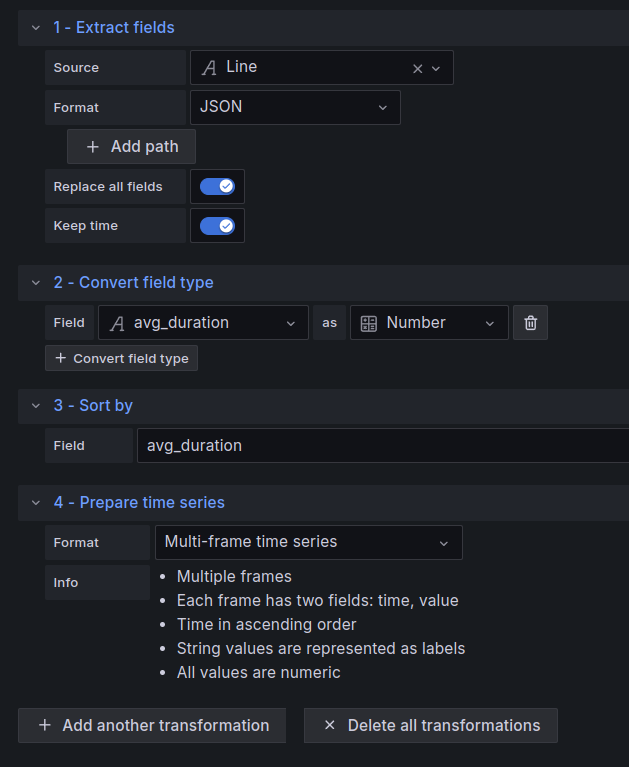
The visualization in Grafana is not yet perfect, because you need to add transformations to make the Grafana panel display the data correctly.
I had to add at least four of them:
- Extract fields : we get the result from VictoriaLogs in JSON, and with this transformation, we extract all the fields from it
-
Convert field type : the
durationfield in JSON comes as a string, so it needs to be changed to Number -
Sort by : sort by the
avg_durationfield - Prepare time series : to convert the results into a format that the Time series visualization panel will understand
Without this, you will get errors like ”Data is missing a number field”, “Data is missing a time field” , or ”Data out of time range”.
Configure the transformations:
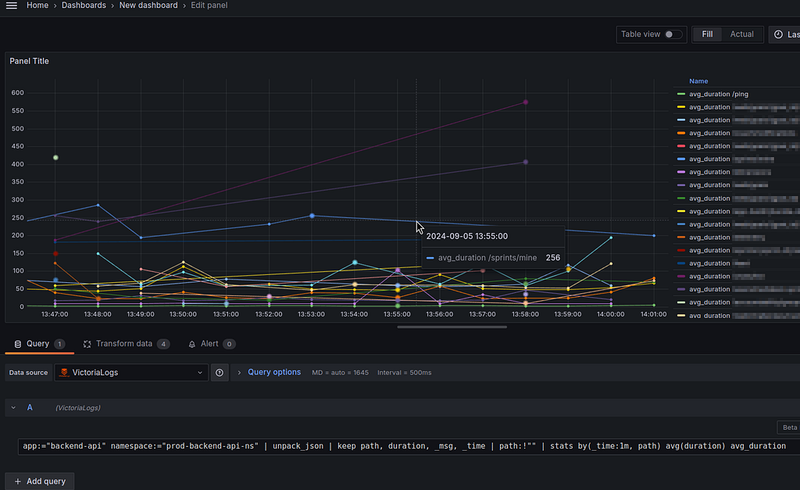
The query for the graph is as follows:
app:="backend-api" namespace:="prod-backend-api-ns" | unpack_json | keep path, duration, _msg, _time | path:!"" | stats by(_time:1m, path) avg(duration) avg_duration
Note that here _time has been moved to the stats() call to get the last minute statistics for each path.
And the result is as follows:
Also, Data source does not yet allow you to rewrite Options > Legend.
Conclusions
It’s hard to draw any conclusions right away, but overall, I like the system and it’s definitely worth trying.
You need to get used to LogsQL and learn how to work with it, but it offers more opportunities.
As for CPU/Memory resources, there are no issues at all.
The Grafana data source is working, waiting for its release and more features added.
We’re also waiting for AWS S3 support and Loki RecordingRules to be added, because today VictoriaLogs can only be used as a system for working with logs, not for graphs or alerts.
It’s pity that ChatGPTs can’t really help with LogsQL queries, because I used them quite often for Loki, but they will learn to do it eventually. However, Perplexity responds with almost no errors.
So, on the plus side:
- it works really fast, and really uses MUCH less resources
- LogsQL is nice with a lot of features
- VictoriaMetrics documentation is always quite detailed, with examples, well-structured
- VictoriaMetrics support is also great — in GitHub Issues, Slack, and Telegram — you can always ask a question and get an answer pretty quickly
- unlike Grafana Loki, VictoriaLogs has its own Web UI, and as for me, this is a big plus
Of the relative disadvantages:
- both VictoriaLogs and its Grafana data source are still in the Beta, so there may be some unexpected problems, and not all features have been implemented yet
- but knowing the VictoriaMetrics team, they do everything quickly enough
- the lack of RecordingRules and AWS S3 support is currently what is blocking me personally from completely removing Grafana Loki
- but all the main features should be delivered by the end of 2024
- ChatGPT/Gemini/Claude don’t know LogsQL very well at all, so don’t expect their help
- but there is help in Slack, and in Telegram from VictoriaMetrics community and development team, and Perplexity gives good enough results
So — Happy Logging!
Originally published at RTFM: Linux, DevOps, and system administration.









Top comments (1)
VictoriaLogs is a tool to collect and read logs fast. It works well in Kubernetes and you can use LogsQL to search data. Grafana makes it easy to see the logs in clear charts.