AWS: VPC Flow Logs, NAT Gateways, and Kubernetes Pods — a detailed overview
We have a relatively large spending on AWS NAT Gateway Processed Bytes, and it became interesting to know what exactly is processed through it.
It would seem that everything is simple — just turn on VPC Flow Logs and see what’s what. But when it comes to AWS Elastic Kubernetes Service and NAT Gateways, things get a little more complicated.
So, what are we going to talk about?
- What is a NAT Gateway in AWS VPC
- what is NAT and Source NAT
- turn on VPC Flow Logs, and understand what exactly is written in them
- and figure out how to find the Kubernetes Pod IP in VPC Flow Logs
The networking architecture is quite standard:
- AWS EKS cluster
- VPCs
- public subnets for Load Balancers and NAT Gateways
- private subnets for Kubernetes Worker Nodes
- dedicated subnets for databases/RDS
- dedicated subnets for Kubernetes Control Plain
Creating the VPC for a cluster is described in the Terraform: Building EKS, part 1 — VPC, Subnets, and Endpoints post.
AWS NAT Gateway Pricing
Documentation — Amazon VPC pricing.
So, when we use NAT Gateway, we pay for:
- each hour of NAT Gateway operation
- gigabytes it processes
An hour of NAT Gateway operation costs $0.045, which means per month it will be:
0.045*24*30
32.400
32 dollars.
There is an option to use NAT Instance instead of NAT Gateway, but then we have to deal with its management — the creation of the instance, its updates, and configuration.
Amazon provides AMIs for this, but they haven’t been updated for a long time, and they won’t be.
Also, the terraform-aws-modules/vpc/aws Terraform module works only with NAT Gateway, so if you want to use NAT Instance, you also have to write automation for it.
So, let’s skip the NAT Instance option and use NAT Gateway as a solution that is fully supported and managed by Amazon and the VPC module for Terraform.
As for the cost of traffic: we pay the same $0.045, but for each gigabyte. Moreover, it counts all the processed traffic — that is, both outbound (egress, TX — Transmitted) and inbound (ingress, RX — Received).
So, when you send one gigabyte of data to an S3 bucket and then upload it back to an EC2 on a private network, you’ll pay $0.045 + $0.045.
What is NAT?
Let’s recall what NAT is in general, and how it works at the packet and network architecture levels.
NAT — Network Address Translation — performs operations on TCP/IP packet headers, changing (translating) the sender or receiver address, allowing network access from or to hosts that do not have their own public IP.
We know that there are several types of NAT:
- Source NAT : the packet “leaves” the private network, and NAT replaces the packet’s IP source with its own before sending it to the Internet (SNAT)
- Destination NAT : the packet “enters” the private network from the Internet, and NAT changes the packet’s destination IP from its own to the private IP inside the network before sending it inside the network (DNAT)
In addition, there are other types: Static NAT, Port Address Translation (PAT), Twice NAT, Multicast NAT.
We’re interested in the Source NAT right now, and we’ll be focusing on it and how the packet gets from the VPC to the Internet.
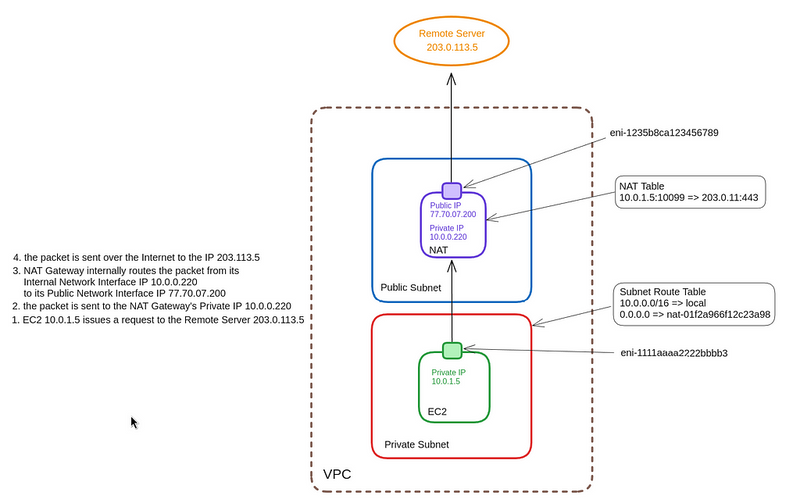
We can represent this with a diagram, and it will look like this:
- Initiating a request from EC2 : a service on EC2 with a Private IP 10.0.1.5 generates a request to the External Server with IP 203.0.113.5 — the EC2 operating system kernel creates a package: -source IP: 10.0.1.5
- packet source IP: 10.0.1.5
- destination IP: 203.0.113.5
- packet destination IP: 203.0.113.5
- Packet routing : the network interface on EC2 is included in the Private Subnet, and has a Route Table that is connected to this subnet — the operating system kernel determines that the destination IP does not belong to the VPC and forwards the packet to NAT GW Private IP 10.0.0.220:
- source IP: 10.0.1.5
- packet source IP: 10.0.1.5
- destination IP: 10.0.0.220
- packet destination IP: 203.0.113.5
- Processing a NAT Gateway packet : the packet arrives at the NAT GW network interface, which has the 10.0.0.220 address — The NAT Gateway stores a record of the origin of the packet from IP 10.0.1.5:10099 => 203.0.11.443 in its NAT table — The GW NAT changes the source IP from 10.0.1.5 to the address of its interface on the public network with IP 77.70.07.200 (the SNAT operation itself), and the packet is sent to the Internet
- source IP: 77.70.07.200
- packet source IP: 10.0.1.5
- destination IP: 203.0.113.5
- packet destination IP: 203.0.113.5
What is the NAT Table?
The NAT table is stored in the NAT Gateway’s memory and is used to accept a packet from the External Server to our EC2 when it sends a response and forward it to the appropriate server on the private network.
Schematically, it can be represented as follows:
Receiving a response from the 203.0.113.5 to itself on 77.70.07.200 and port 20588, the NAT Gateway uses the table to find the corresponding recipient — IP 10.0.1.5 and port 10099.
Okay. Now that we’ve remembered what NAT is, let’s enable VPC Flow Logs and take a look at the records it creates.
See The Network Address Translation Table.
Setting up AWS VPC Flow Logs
See also AWS: VPC Flow Logs — an overview and example with CloudWatch Logs Insights.
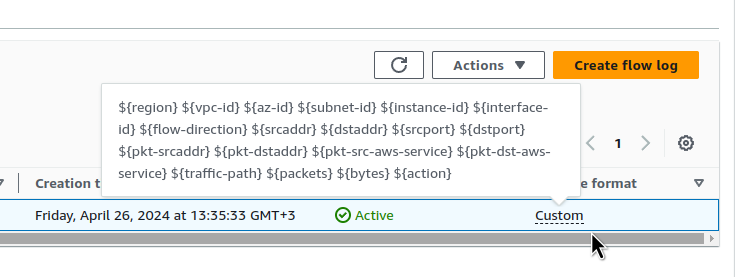
VPC Flow Logs can be configured manually in the AWS Console:
Or, if you use the Terraform module terraform-aws-modules/vpc, then set the parameters in it:
...
module "vpc" {
  source = "terraform-aws-modules/vpc/aws"
  version = "~> 5.5.2"

  name = local.env_name
  cidr = var.vpc_params.vpc_cidr

  ...

  enable_flow_log = var.vpc_params.enable_flow_log

  create_flow_log_cloudwatch_log_group = true
  create_flow_log_cloudwatch_iam_role = true

  flow_log_max_aggregation_interval = 60
  flow_log_cloudwatch_log_group_name_prefix = "/aws/${local.env_name}-flow-logs/"
  flow_log_log_format = "$${region} $${vpc-id} $${az-id} $${subnet-id} $${instance-id} $${interface-id} $${flow-direction} $${srcaddr} $${dstaddr} $${srcport} $${dstport} $${pkt-srcaddr} $${pkt-dstaddr} $${pkt-src-aws-service} $${pkt-dst-aws-service} $${traffic-path} $${packets} $${bytes} $${action}"
  #flow_log_cloudwatch_log_group_class = "INFREQUENT_ACCESS"

}
...
Execute terraform apply, and now we have VPC logs with our own format:
VPC Flow Logs — format
The flow_log_log_format describes the format of how the log will be written, namely, what fields it will contain.
I always use a custom format with additional information, because the default format may not be informative enough, especially when working through NAT Gateways.
All fields are available in the documentation Logging IP traffic using VPC Flow Logs.
For Terraform, we escape the records containing ${...} through an additional $.
Costs of the VPC Flow Logs in CloudWatch Logs
The flow_log_cloudwatch_log_group_class allows you to specify either Standard or Infrequent Access class, and Infrequent Access will be cheaper, but it has limitations - see Log classes.
In my case, I plan to collect logs to Grafana Loki via CloudWatch Log Subscription Filter, so I need the Standard type. But we’ll see — maybe I’ll set up an S3 bucket, and then, perhaps, I can use Infrequent Access.
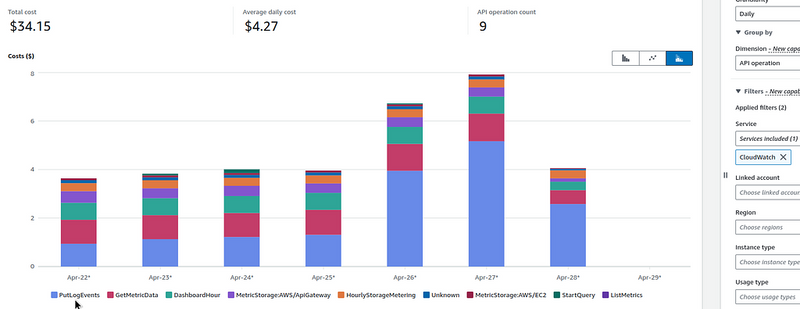
In fact, the cost of traffic logging is quite noticeable.
For example, in a small VPC where our Backend API, monitoring (see VictoriaMetrics: deploying a Kubernetes monitoring stack) and several other services are running in Kubernetes, after enabling VPC Flow Logs, the cost of CloudWatch began to look like this:
So keep this in mind.
VPC Flow Logs in CloudWatch Logs vs AWS S3
Storing logs in CloudWatch Logs will be more expensive, but it allows you to run queries in CloudWatch Logs Insights.
In addition, I think it’s easier to set up log collection to Grafana Loki through CloudWatch Subscription Filters than through S3 — just less IAM headaches.
For more information about Loki and S3, see Grafana Loki: collecting AWS LoadBalancer logs from S3 with Promtail Lambda.
For more information on Loki and CloudWatch, see Loki: collecting logs from CloudWatch Logs using Lambda Promtail.
However, for now, I’m keeping Flow Logs in CloudWatch Logs, and when I’m done figuring out where the traffic is coming from/to, I’ll think about using S3, and from there I’ll collect it to Grafana Loki.
VPC Flow Logs and Log Insights
Okay, so we have VPC Flow Logs configured in CloudWatch Logs.
What we are particularly interested in is traffic through the NAT Gateway.
Using a custom log format, we can make such a query in the Logs Insights:
parse @message "* * * * * * * * * * * * * * * * * * *"
| as region, vpc_id, az_id, subnet_id, instance_id, interface_id,
| flow_direction, srcaddr, dstaddr, srcport, dstport,
| pkt_srcaddr, pkt_dstaddr, pkt_src_aws_service, pkt_dst_aws_service,
| traffic_path, packets, bytes, action
| filter (dstaddr like "10.0.5.175") | stats sum(bytes) as bytesTransferred by interface_id, flow_direction, srcaddr, srcport, dstaddr, dstport, pkt_srcaddr, pkt_dstaddr, pkt_src_aws_service, pkt_dst_aws_service, bytes
| sort bytesTransferred desc
| limit 10
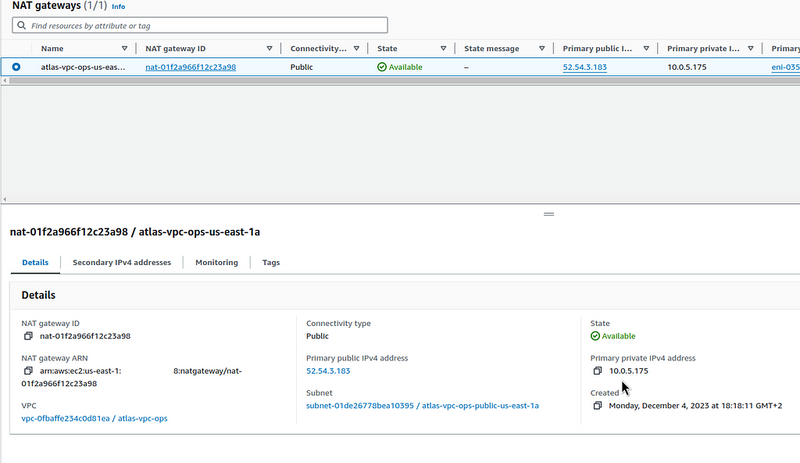
Here, we filter for requests that have the Private IP of our NAT Gateway in the dstaddr field:
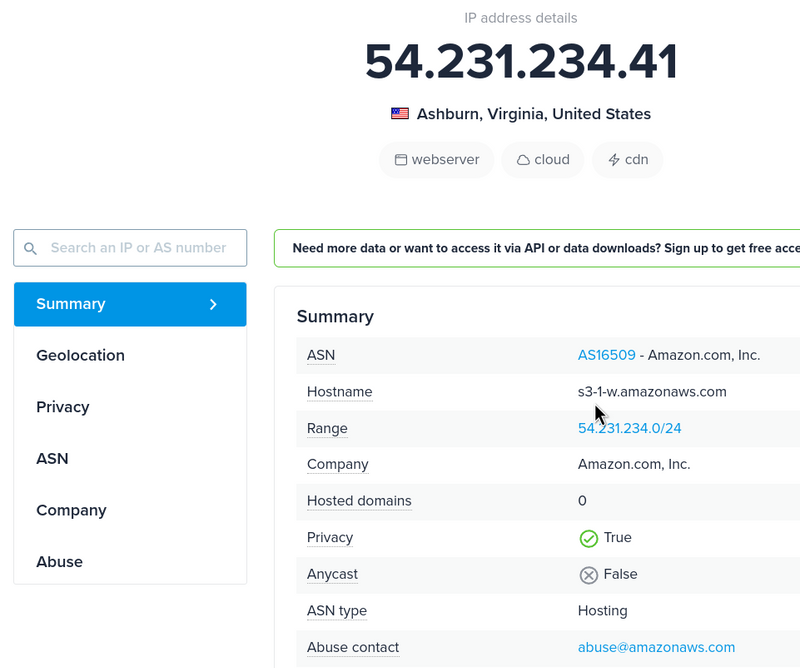
Sometimes pkt_src_aws_service or pkt_dst_aws_service are empty, and then it is not obvious what kind of traffic it is.
You can check an IP on the https://ipinfo.io — it may contain a hostname, and then it is clear that it is, for example, an S3 endpoint:
Flow Logs ingress vs egress
We know that ingress is incoming traffic (RX, Received), and egress is outgoing traffic (TX, Transmitted).
But inbound and outbound relatively to what? VPC, Subnet, or ENI — Elastic Network Interface?
Read the documentation Logging IP traffic using VPC Flow Logs:
- flow-direction: The direction of the flow with respect to the interface where traffic is captured. The possible values are: ingress | egress.
That is, in relation to the network interface: if traffic comes to the EC2 interface or NAT Gateway (which is a regular EC2 under the hood), it is ingress, if it leaves the interface, it is egress.
The difference in srcaddr vs pkt-srcaddr, and dstaddr vs pkt-dstaddr
We have four fields that indicate the recipients.
At the same time, for source and destination, we have two different types of fields — with or without the pkt- prefix.
What’s the difference:
-
srcaddr- is the "current" routing: -- for incoming traffic — is an address where the packet came from, or : -- for outgoing traffic — an interface address that sends traffic -
dstaddr- is the "current" routing: -- for outgoing traffic — an address of the “destination” of the packet, or
-- for incoming traffic — an address of the network interface of the “destination” of the packet -
pkt-srcaddr: an "original" address of the package origin -
pkt-dstaddr: an "original" address of the packet's "destination"
To better understand these fields and the structure of Flow Logs records in general, let’s look at a few examples from the documentation.
Flow Logs and sample records
So, we have an EC2 instance on a private network that makes requests to some external service through a NAT Gateway.
What will we see in the logs?
The examples are taken from the documentation Traffic through a NAT gateway, and I added some diagrams to make it easier to understand visually.
We will use a real data:
- we have an EC2 instance in a private subnet:
- Elastic Network Interface:
eni-0467f85cabee7c295 - Private IP:
10.0.36.132 - we have a NAT Gateway:
- Elastic Network Interface:
eni-0352f8c82da6aa229 - Private IP:
10.0.5.175 - Public IP:
52.54.3.183
On the EC2, curl is running in a loop with a request to 1.1.1.1:
root@ip-10-0-36-132:/home/ubuntu# watch -n 1 curl https://1.1.1.1
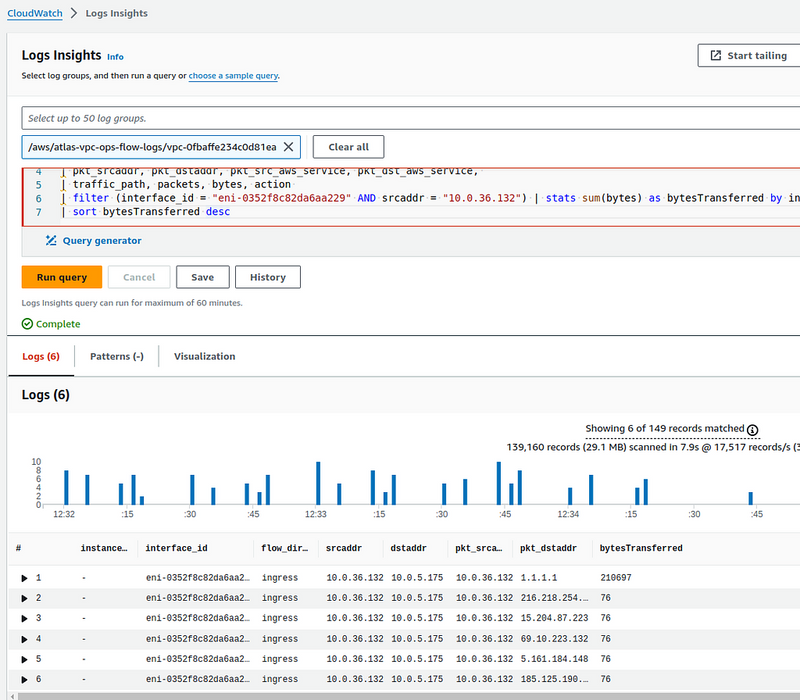
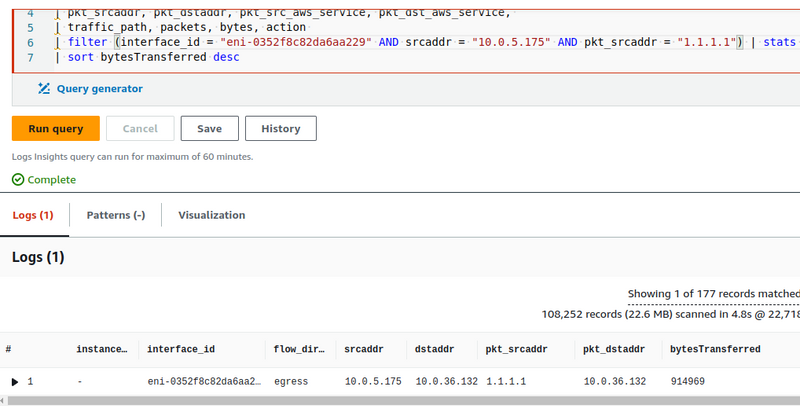
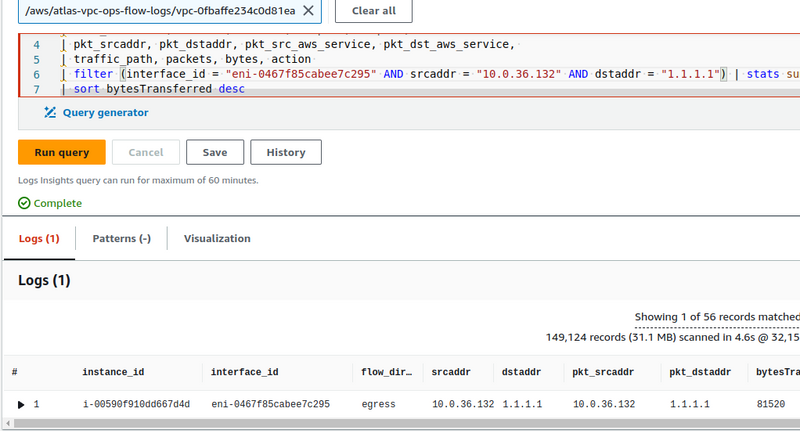
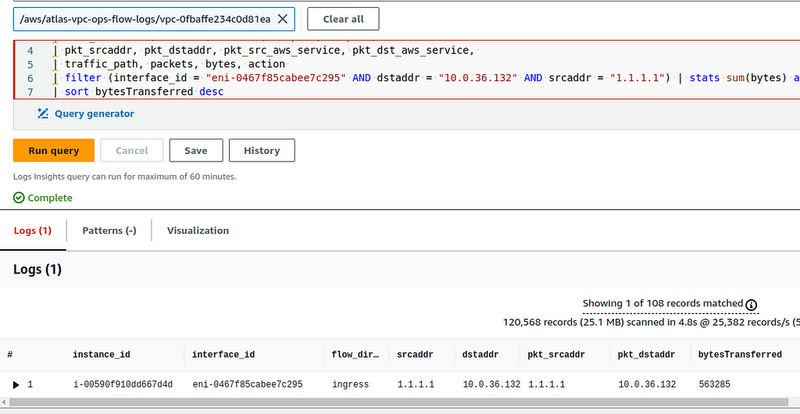
The format of the VPC Flow Log is the same as above, and we will use the following query to check it in CloudWatch Logs Insights:
parse @message "* * * * * * * * * * * * * * * * * * *"
| as region, vpc_id, az_id, subnet_id, instance_id, interface_id,
| flow_direction, srcaddr, dstaddr, srcport, dstport,
| pkt_srcaddr, pkt_dstaddr, pkt_src_aws_service, pkt_dst_aws_service,
| traffic_path, packets, bytes, action
| filter (interface_id = "eni-0352f8c82da6aa229" AND srcaddr = "10.0.36.132") | stats sum(bytes) as bytesTransferred by instance_id, interface_id, flow_direction, srcaddr, dstaddr, pkt_srcaddr, pkt_dstaddr
| sort bytesTransferred desc
Here, we select records from the NAT Gateway and the Private IP network interface of our EC2:
So, in the results, we will have “instance_id, interface_id, flow_direction, srcaddr, dstaddr, pkt_srcaddr, pkt_dstaddr".
NAT Gateway Elastic Network Interface records
First, let’s look at the records related to the NAT Gateway network interface.
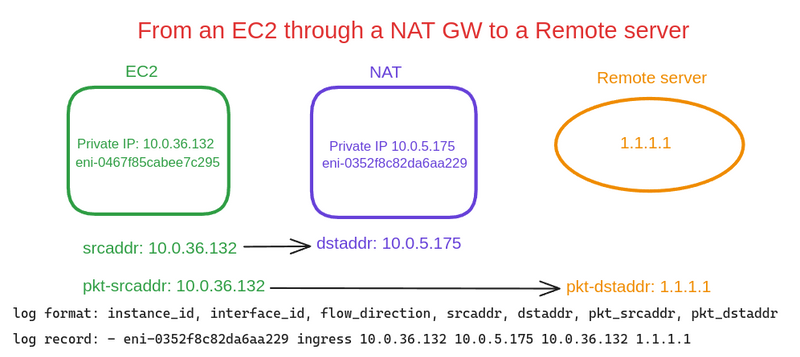
From the EC2 through the NAT GW to the Remote server
The first example of a Flow Logs entry displays information from the NAT Gateway network interface, which records the flow of a packet from EC2 on a private network to an external server:
When working with VPC Flow Logs, the main thing to remember is that records are made for each interface.
That is, if we make curl 1.1.1.1 from an EC2 instance, we will get two records in the Flow Log:
- from the Elastic Network Interface on the EC2 itself
- from Elastic Network Interface on the NAT Gateway
In this example, we see a record from the NAT Gateway interface, because:
- the
instace-idfield is empty (although NAT GW is an EC2, it is still an Amazon-managed service) -
flow-direction- ingress , the packet arrived at the NAT Gateway interface - in the
dstaddrfield, we see the Private IP of our NAT GW - and the
pkt-dstaddrfield does not match dstaddr - in thepkt-dstaddrwe have the address of the "final recipient", and the packet came to thedstaddr- NAT Gateway
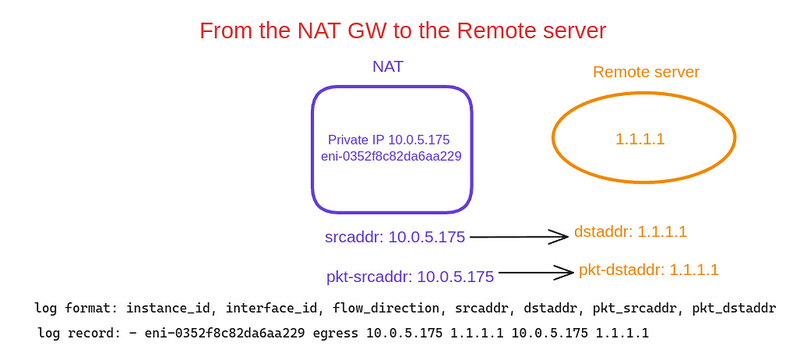
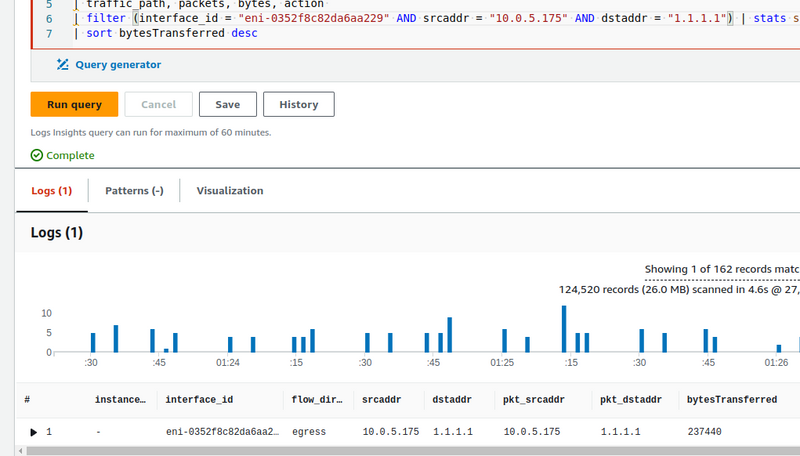
NAT Gateway Remote Server
В другому прикладі бачимо запис про пакет, який було відправлено з NAT Gateway до Remote Server:
-
flow-direction- egress , the packet was sent from the NAT Gateway interface -
srcaddrandpkt-srcaddrare the same -
dstaddrandpkt-dstaddrare the same
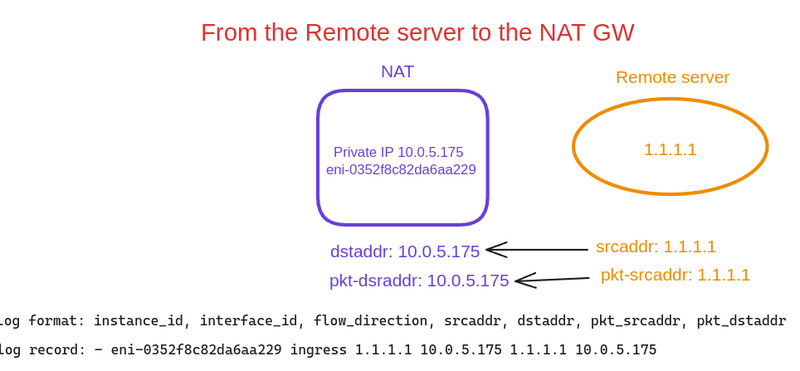
From the Remote Server to the NAT Gateway
Next, our Remote Server sends a response to our NAT Gateway:
-
flow-direction- ingress , the packet arrived at the NAT Gateway interface -
srcaddrandpkt-srcaddrare the same -
dstaddrandpkt-dstaddrare the same
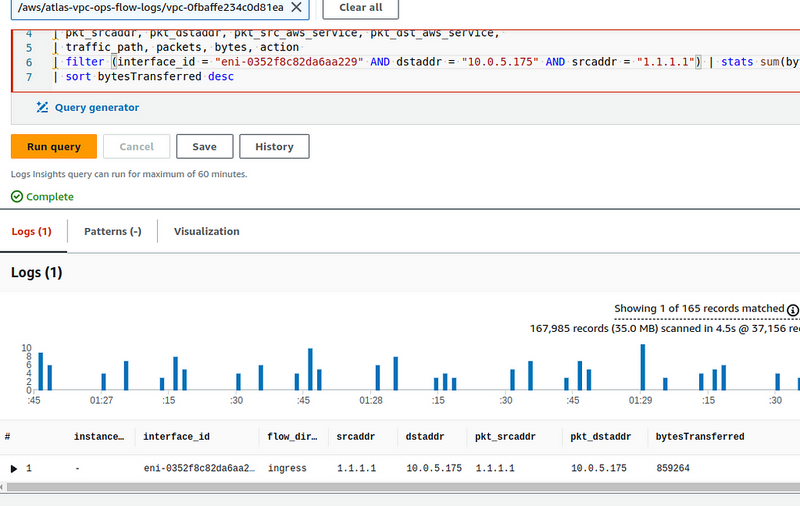
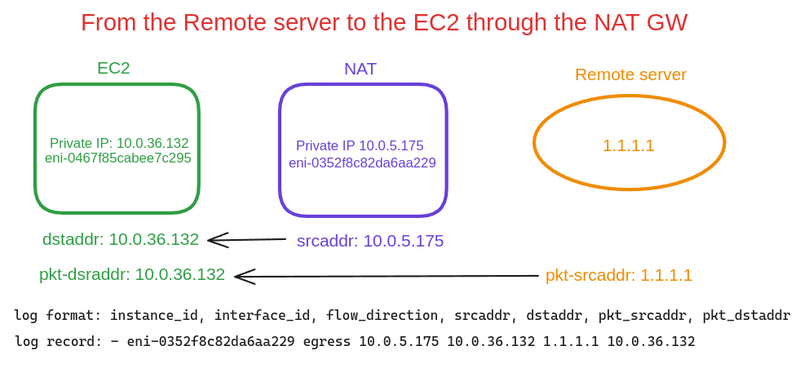
From the Remote Server through the NAT Gateway to the EC2
A record of the packet from the Remote Server to our EC2 through the NAT Gateway:
-
flow-direction- egress , the packet was sent from the NAT Gateway interface -
srcaddrandpkt-srcaddrare different - in thesrcaddrwe have the NAT GW IP, and in thepkt-srcaddr- the IP of the Remote Server -
dstaddrandpkt-dstaddrare the same, with the IP of our EC2
EC2 Network Interface records
And a couple of examples of Flow Logs records related to the EC2 Elastic Network Interface.
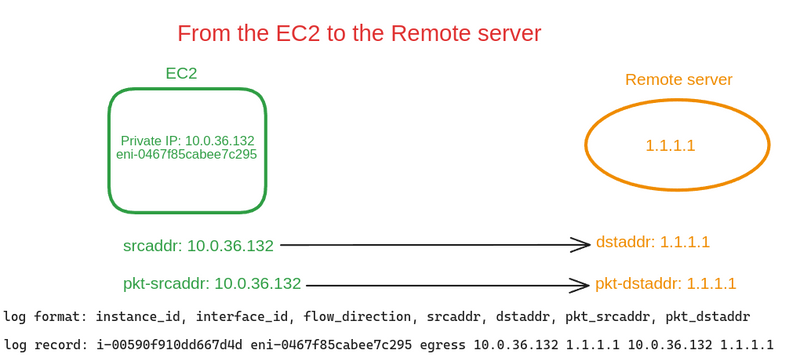
From the EC2 to the Remote Server
Sending a request from the EC2 to the Remote Server:
-
instance_idis not empty -
flow-direction- egress , because the record is from the EC2 interface, which sends the packet to the Remote Server - The
srcaddrandpkt-srcaddrare the same, with the Private IP of this EC2 - the
dstaddrandpkt-dstaddrfields are also the same, with the Remote Server address
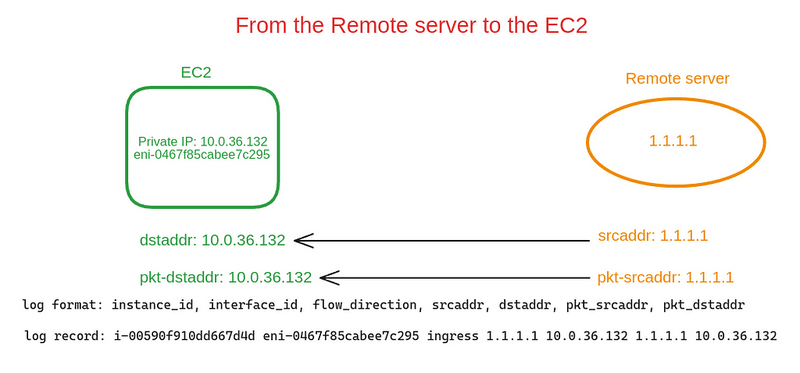
From the Remote Server to the EC2
Sending a request from the Remote Server to the EC2:
-
instance_idis not empty -
flow-direction- ingress , because the record is from the EC2 interface that receives the packet from the Remote Server -
srcaddrandpkt-srcaddrare the same, with the Remote Server IP address - the
dstaddrandpkt-dstaddrfields are also the same, with the Private IP of this EC2
VPC Flow Logs, NAT, Elastic Kubernetes Service, and Kubernetes Pods
Okay, we have seen how to find information about traffic through the NAT Gateway from EC2 instances.
But what about Kubernetes Pods?
The situation here is even more interesting because we have different types of network communication:
- Worker Node to Pod
- Worker Node to ClusterIP
- Pod to ClusterIP Service
- Pod to Pod on one Worker Node
- Pod to Pod on different Worker Nodes
- Pod to External Server
Pods have IP addresses from the VPC CIDR pool, and these IPs are connected to the WorkerNode as Secondary Private IPs (or taken from the connected /28 prefixes in the case of VPC CNI Prefix Assignment Mode — see Activating VPC CNI Prefix Assignment Mode in AWS EKS).
When communicating Pod to Pod, if they are in the same VPC, then their IP/WorkerNode Secondary Private IPs are used. But if they are on the same WorkerNode, the packet will go through virtual network interfaces, not through the “physical” interface on the WorkerNode/EC2, and, accordingly, we will not see this traffic in Flow Logs at all.
But when the Pod sends traffic to an external resource, the VPC CNI plugin changes (translates) the Pod IP to the WorkerNode Primary Private IP by default, and, accordingly, in the Flow Logs we will not see the IP of the Pod that sends traffic through the NAT Gateway.
That is, we have one SNAT happening at the kernel level of the WorkerNode/EC2 operating system, and then another one on the NAT Gateway.
The exception is if the Pod is launched with the hostNetwork: true.
Documentation — SNAT for Pods.
Let’s check it out.
Pod to Pod traffic, and VPC Flow Logs
Let’s start two Kubernetes Pods. Add antiAffinity and topologyKey so they will run on two different WorkerNodes (see Kubernetes: Pods and WorkerNodes – control the placement of the Pods on the Nodes):
apiVersion: v1
kind: Pod
metadata:
  name: ubuntu-pod1
  labels:
    app: ubuntu-app
    pod: one
spec:
  containers:
  - name: ubuntu-container1
    image: ubuntu
    command: ["sleep"]
    args: ["infinity"]
    ports:
    - containerPort: 80
  affinity:
    podAntiAffinity:
      requiredDuringSchedulingIgnoredDuringExecution:
      - labelSelector:
          matchLabels:
            app: ubuntu-app
        topologyKey: "kubernetes.io/hostname"
---
apiVersion: v1
kind: Pod
metadata:
  name: ubuntu-pod2
  labels:
    app: ubuntu-app
    pod: two
spec:
  containers:
  - name: ubuntu-container2
    image: ubuntu
    command: ["sleep"]
    args: ["infinity"]
    ports:
    - containerPort: 80
  affinity:
    podAntiAffinity:
      requiredDuringSchedulingIgnoredDuringExecution:
      - labelSelector:
          matchLabels:
            app: ubuntu-app
        topologyKey: "kubernetes.io/hostname"
Deploy them, and install curl on the first one, and NGINX on the second.
Now we have:
- ubuntu-pod1 :
- Pod IP: 10.0.46.182
- WorkerNode IP: 10.0.42.244
- ubuntu-pod2 :
- Pod IP: 10.0.46.127
- WorkerNode IP: 10.0.39.75
On the second one, start NGINX, and from the first Pod run curl in a loop to the IP of the second Pod:
root@ubuntu-pod1:/# watch -n 1 curl 10.0.46.127
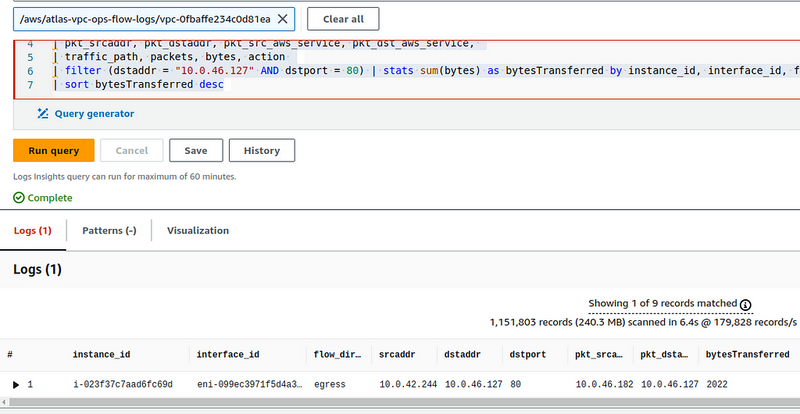
And in a minute, check Flow Logs with a query:
parse @message "* * * * * * * * * * * * * * * * * * *"
| as region, vpc_id, az_id, subnet_id, instance_id, interface_id,
| flow_direction, srcaddr, dstaddr, srcport, dstport,
| pkt_srcaddr, pkt_dstaddr, pkt_src_aws_service, pkt_dst_aws_service,
| traffic_path, packets, bytes, action
| filter (dstaddr = "10.0.46.127" AND dstport = 80) | stats sum(bytes) as bytesTransferred by instance_id, interface_id, flow_direction, srcaddr, dstaddr, dstport, pkt_srcaddr, pkt_dstaddr
| sort bytesTransferred desc
In the srcaddr we have the Primary Private IP from the WorkerNode running the ubuntu-pod-1 Pod, and in the pkt_srcaddr we have the IP of the Pod itself that makes the requests.
Traffic from the Pod to the External Server through the NAT Gateway, and VPC Flow Logs
Now, without changing anything, let’s run curl to 1.1.1.1 from the same Pod ubuntu-pod1 , and check the logs:
In the first record we have:
-
eni-0352f8c82da6aa229- the NAT Gateway interface -
flow-direction- ingress , the interface received a packet -
srcaddr10.0.42.244 - the address of the WorkerNode where ubuntu-pod1 Pod is running -
dstaddr10.0.5.175 - packet is for the NAT Gateway -
pkt_dstaddr1.1.1.1 - and the packet is destined for the Remote Server
Next, in the second record:
- the same network interface of the NAT GW
- but now it is egress — the packet has left the interface
-
srcaddr10.0.5.175 - packet is from the NAT GW
And the third record:
- instance i-023f37c7aad6fc69d - where our Pod ubuntu-pod1 is running
- traffic egress — the packet left the interface
-
srcaddr10.0.42.244 - packet from the Private IP of this WorkerNode - and
dstaddr1.1.1.1 - the packet is for the Remote Server
But we don’t see the IP of the Kubernetes Pod itself anywhere.
Kubernetes Pod, hostNetwork: true, and VPC Flow Logs
Let’s reconfigure the ubuntu-pod1 with the hostNetwork: true:
apiVersion: v1
kind: Pod
metadata:
  name: ubuntu-pod1
  labels:
    app: ubuntu-app
    pod: one
spec:
  hostNetwork: true
  containers:
  - name: ubuntu-container1
    image: ubuntu
    command: ["sleep"]
    args: ["infinity"]
    ports:
    - containerPort: 80
  affinity:
    podAntiAffinity:
      requiredDuringSchedulingIgnoredDuringExecution:
      - labelSelector:
          matchLabels:
            app: ubuntu-app
        topologyKey: "kubernetes.io/hostname"
Deploy it and check the IP of the Pod itself and the IP of its WorkerNode:
$ kubectl describe pod ubuntu-pod1
Name: ubuntu-pod1
...
Node: ip-10-0-44-207.ec2.internal/10.0.44.207
...
Status: Running
IP: 10.0.44.207
...
Both IPs are the same, so if we make curl 1.1.1.1 from this Pod, then in Flow Logs we will see the IP of the Pod (and in fact, the IP of the Worker Node on which this Pod is running).
But using hostNetwork: true is a bad idea (security, possible problems with TCP ports, etc.), so we can do it in another way.
AWS EKS, and Source NAT for Pods
If we disable SNAT for Pods in the VPC CNI of our cluster, then SNAT operations will be performed only on the NAT Gateway of the VPC, and not twice — first on the WorkerNode and then on the NAT Gateway.
See AWS_VPC_K8S_CNI_EXTERNALSNAT and AWS_VPC_K8S_CNI_EXCLUDE_SNAT_CIDRS.
And, accordingly, we will see the real IPs of our Pods in the logs.
Update the VPC CNI configuration:
$ kubectl set env daemonset -n kube-system aws-node AWS_VPC_K8S_CNI_EXTERNALSNAT=true
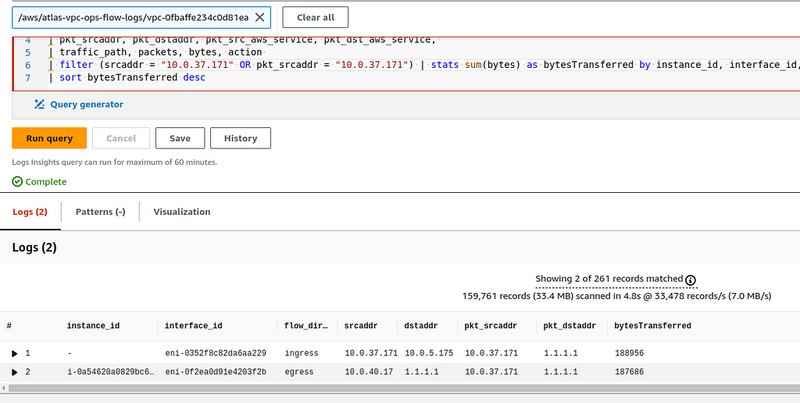
Restore the config for ubuntu-pod-1 without the hostNetwork: true, deploy it, and look at the logs with this query:
parse @message "* * * * * * * * * * * * * * * * * * *"
| as region, vpc_id, az_id, subnet_id, instance_id, interface_id,
| flow_direction, srcaddr, dstaddr, srcport, dstport,
| pkt_srcaddr, pkt_dstaddr, pkt_src_aws_service, pkt_dst_aws_service,
| traffic_path, packets, bytes, action
| filter (srcaddr = "10.0.37.171" OR pkt_srcaddr = "10.0.37.171") | stats sum(bytes) as bytesTransferred by instance_id, interface_id, flow_direction, srcaddr, dstaddr, pkt_srcaddr, pkt_dstaddr
| sort bytesTransferred desc
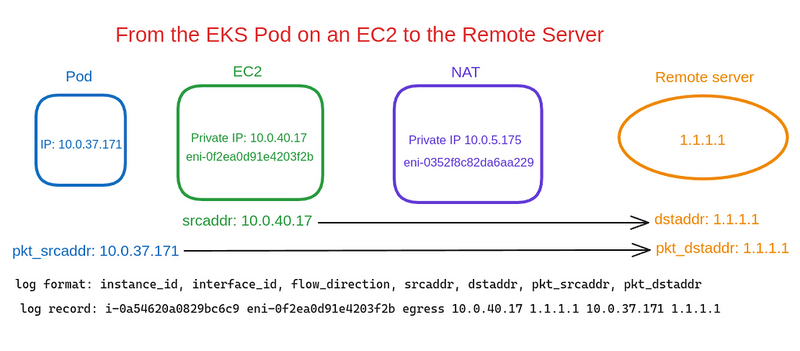
We have two records:
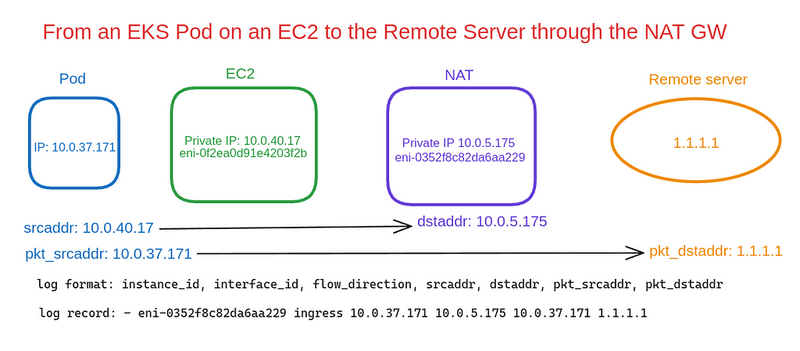
The first record is from the NAT Gateway interface, which received a packet from the Pod with the IP 10.0.37.171 for the Remote Server with the IP 1.1.1.1:
The second record is from the EC2 interface, which makes a request to the Remote Server, but now we have the pkt_srcaddr not the same as the srcadd (as it was in the diagram " From EC2 to Remote Server" above), but has a record of the IP of our Kubernetes Pod:
And now we can track which Kubernetes Pod sends or receives traffic through the NAT Gateway from DynamoDB tables or S3 buckets.
Useful links
- RFC IP Network Address Translator (NAT) Terminology and Considerations
- Pv4 Packet Header
- CloudWatch Logs Insights query syntax
- How do I find the top contributors to NAT gateway traffic in my Amazon VPC?
- Using VPC Flow Logs to capture and query EKS network communications
- Kubernetes: Service, load balancing, kube-proxy, and iptables
- Identifying the Source of Network Traffic Originating from Amazon EKS Clusters
- The hidden cross AZ cost: how we reduced AWS Data Transfer cost by 80%
- Monitor NAT gateways with Amazon CloudWatch
- How do I reduce data transfer charges for my NAT gateway in Amazon VPC?
- AWS NAT Gateway Pricing: How To Reduce Your Costs In 5 Steps
- How do I find the top contributors to NAT gateway traffic in my Amazon VPC?
Originally published at RTFM: Linux, DevOps, and system administration.








Top comments (1)
This is a helpful guide about AWS. It explains how VPC Flow Logs, NAT Gateways, and Kubernetes Pods work. culvers menu Makes it easy to understand cloud networking.