Introduction
We have been largely using APIs in our day to life to perform various operation in an application. APIs are quite crucial in establishing a connection between two intermediate services to maintain the dataflow.
But managing and monitoring large number of APIs can be very overwhelming and time-consuming, and we still might miss some deeper insights if we do it manually. In such a situation, Speedscale comes into play.
Speedscale is a framework that offers traffic replay using realistic API traffic and provides with auto-generated tests to simulate the load or chaos and infer the confidence by measuring the performance of the APIs inside the Kubernetes Clusters.
In this tutorial, we will simply spin up a Civo managed Kubernetes cluster, add Speedscale to the cluster and then patch it's sidecar with one of the application deployments to gain insights into the real-time API traffic for that deployment.
Creating a Civo Managed Kubernetes Cluster
Now we will start by creating a Kubernetes Cluster using the Civo Dashboard.
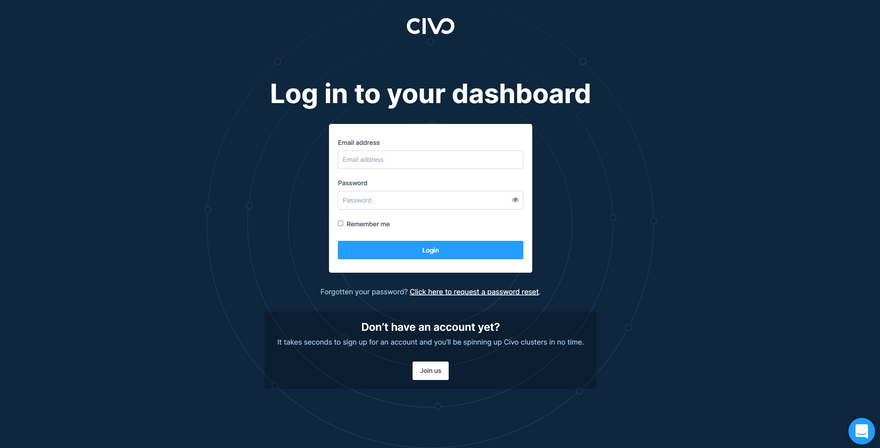
Step 1: Log in to the Civo dashboard with your credentials or you can simply sign up here if you don't have an account yet. Civo provides 250$ worth of free credits for 1 month to its new users so that they can explore the platform freely.
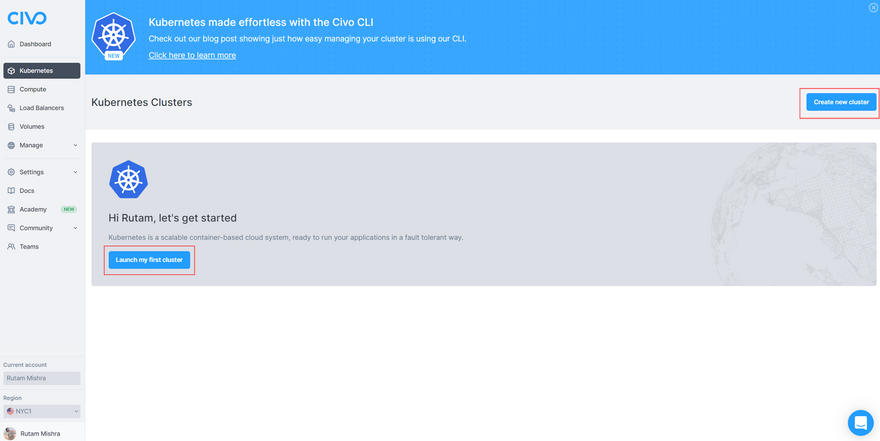
Step 2: Once you are logged in, make sure Kubernetes is selected in the left navigation pane and then click on Create new cluster or Launch my first cluster to open the cluster configuration dashboard.
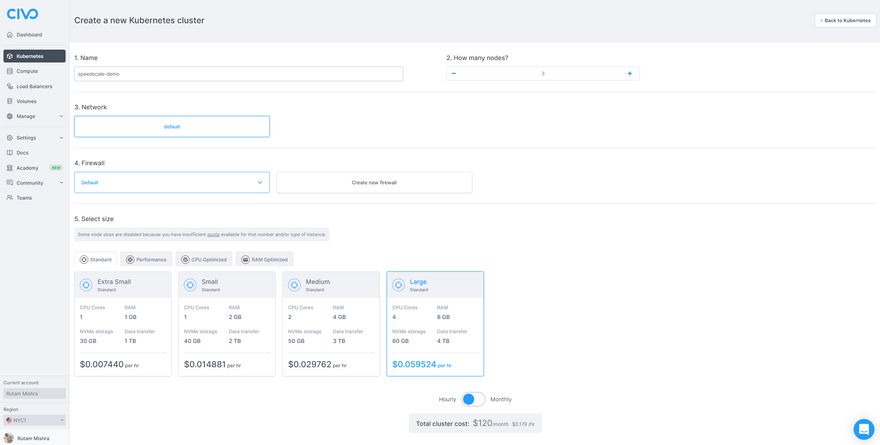
Step 3: Once you're on the configuration page, you can select the specs you wish to have for your cluster. For the sake of this tutorial, you can use the specs mentioned below.
->Name- Give a name as you want (For e.g, speedscale-demo)
->Network- default
->Firewall- Deafult, unless you want to configure anything specific
->Select size- Large Standard (Switch to Hourly mode)
->Show advanced options- Leave it at default
->Marketplace- You can leave it at default or select any app if you wish to install (For e.g., Helm from Management Tab)
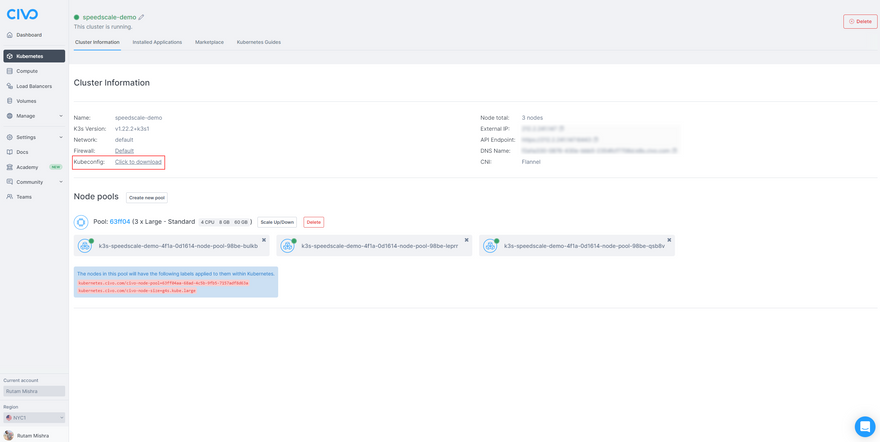
Now click on Create cluster and wait for it to get provisioned. This should take a while.
Step 4: Once the cluster is ready, simply download the kubeconfig and merge it in the config file in the .kube folder on your local system or you can simply overwrite it as well.
Note: If you've merged the
kubeconfigin your existing config file, then make sure to switch the context to use the cluster you've just created. You can do that with the command below.kubectl config use-context CONTEXTNAME
Step 5: Now we will simply try to fetch the list of nodes using kubectl to cross-check if we are able to interact with the cluster or not. Run the command below to get it done.
kubectl get nodes
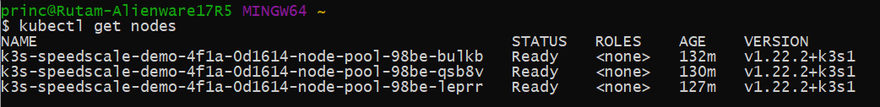
If it successfully returns the list of nodes, then we are good to go with the next steps.
Note: If you need help with configuring
kubectl, then you can find a detailed guide here.
Deploying Speedscale on the Cluster
Now we need to create a deployment for the Speedscale Kubernetes operator. Let's do it in the subsequent steps below.
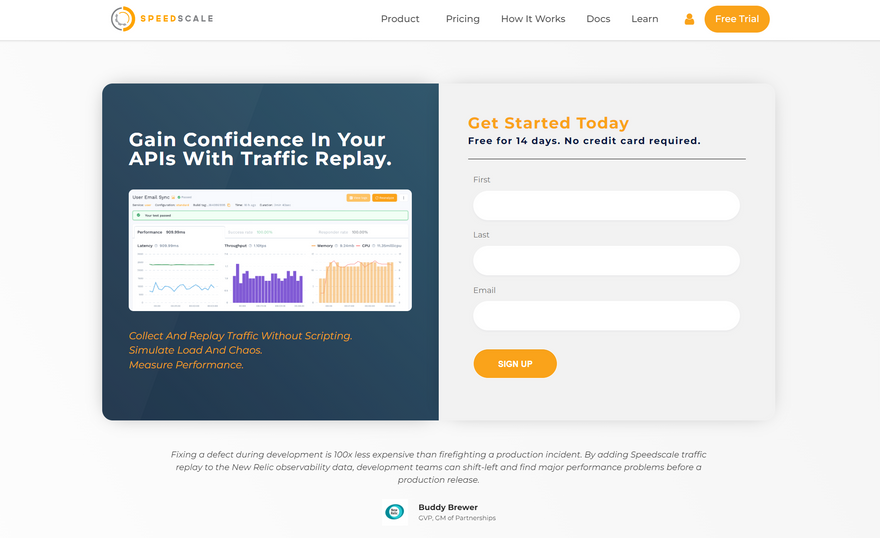
Step 1: Sign up for a Free Trial account on Speedscale. Speedscale offers a 14-day trial and also a free community edition for all types of users.
Step 2: Once you've signed up, you should receive a mail with the available ways to install Speedscale (Either using the Helm Chart or the command line tool). Also, log in to your dashboard and stay signed in as we will come back to use this dashboard at a later stage in this tutorial.
For complete steps on using Helm chart, visit here.
For complete steps on using command line tool visit here or for using the install wizard visit here.

Step 3: For now, we will use the helm chart to install the Speedscale operator on our cluster.
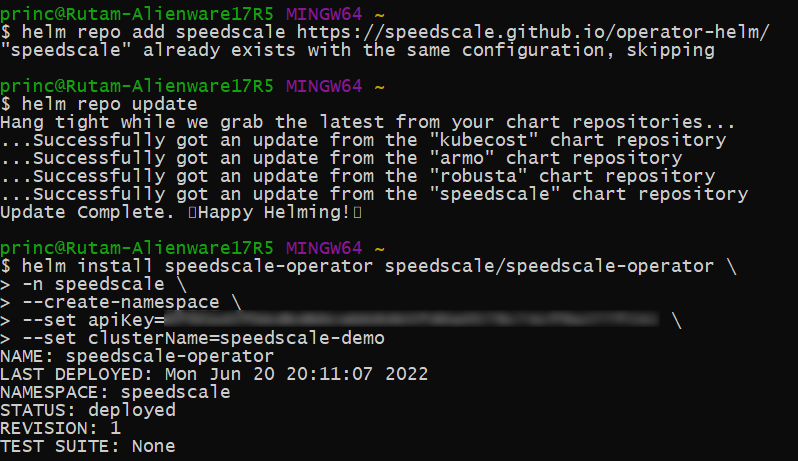
-> Add the Speedscale repo using Helm first. Use the command below to do so.
helm repo add speedscale https://speedscale.github.io/operator-helm/
-> Check and update the repo
helm repo update
-> Now to install the chart, use the command below replacing the placeholders for your Speedscale API Key and the Cluster Name where you want to deploy.
helm install speedscale-operator speedscale/speedscale-operator \
    -n speedscale \
    --create-namespace \
    --set apiKey=<YOUR-SPEEDSCALE-API-KEY> \
    --set clusterName=<YOUR-CLUSTER-NAME>
Note: If you face a pre-install job failure while installing, then you can follow the troubleshooting guide here.
Step 4: Now let's check the pods to confirm whether the Speedscale charts are deployed or not.
kubectl get pods -n speedscale
This should return a list of pods in the speedscale namespace.
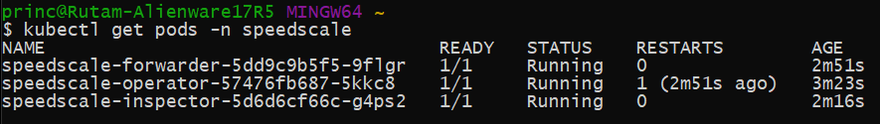
We are now ready with our Speedscale Kubernetes operator and can proceed with the next steps.
Deploying the Demo Podtato App
We will now deploy a demo app and stress test the API by pinging it multiple times. So, let's get started with that.
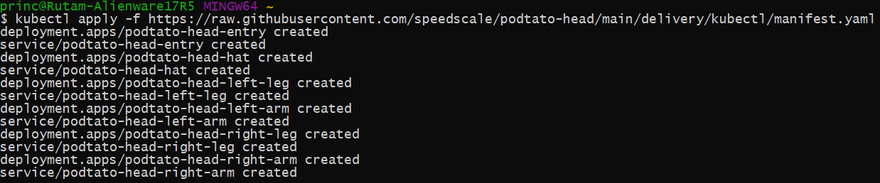
Step 1: Let's deploy the app using the Podtato yaml file. we can do that with the command below.
kubectl apply -f https://raw.githubusercontent.com/speedscale/podtato-head/main/delivery/kubectl/manifest.yaml
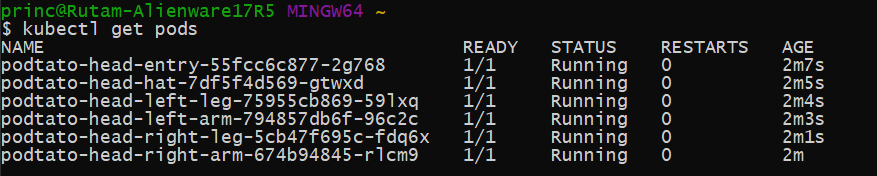
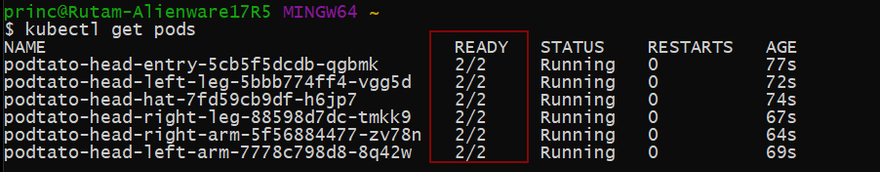
Step 2: Now lets check if the respective pods for the app are already deployed or not.
kubectl get pods (As it was deployed in the default namespace.)
Step 3: Now let's open this app in browser to check how it looks. The URL should look something like this.
http://[YOUR CLUSTER EXTERNAL IP]:31000/
Step 4: Now let's patch the Podtato app with the Speedscale operator sidecars to keep track of the traffic coming in/out of the app. We can achieve this with the command below.
kubectl annotate deployment --all sidecar.speedscale.com/inject="true"
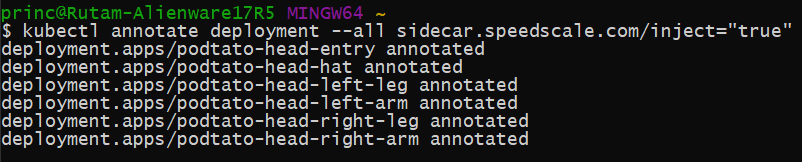
We have now the Speedscale sidecars running with the Podtato app pods making it 2 deployments in Running state. Let's move on to the next steps now.
Load testing the Podtato App
It's time to put some load now on the Podtato app to trace them on the Speedscale dashboard and analyze the traffic. Follow the steps below and we should be good to go.
Step 1: Now we can simply generate some load/traffic by hitting the Podtato app URL multiple times or by simply refreshing the browser tab.
Step 2: After a while, we can see that our Podtato app services get enlisted in the Speedscale Dashboard. This ensures that the sidecars are successfully capturing the traffic logs.
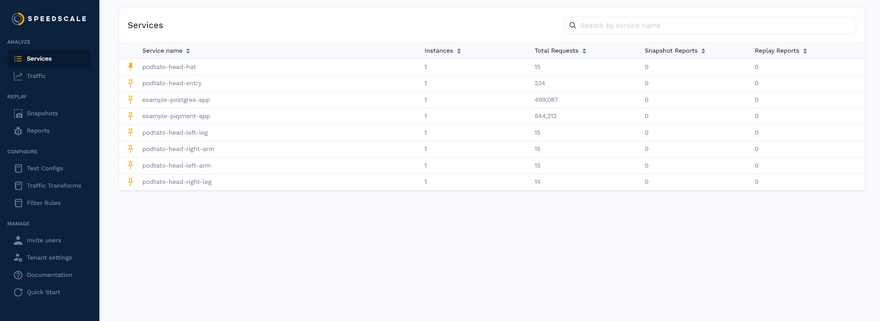
Step 3: Now if we click on each of the service names, it will take us to the Services insights page where we can see specific details about the services, the inbound/outbound transfer rates and health of the service.
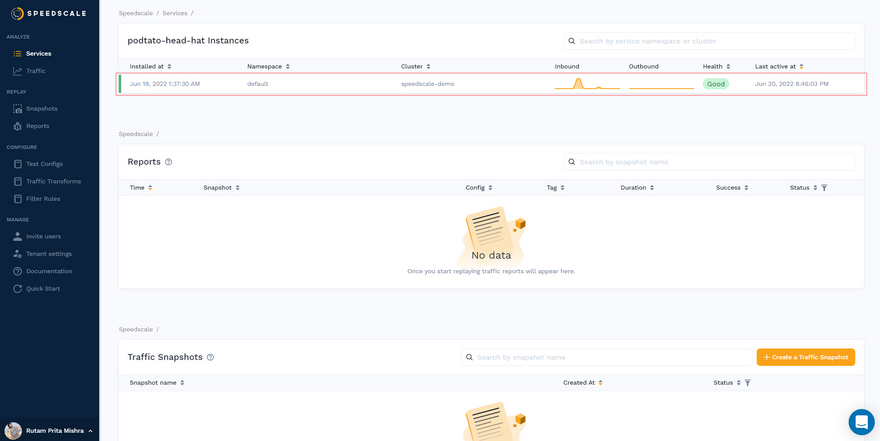
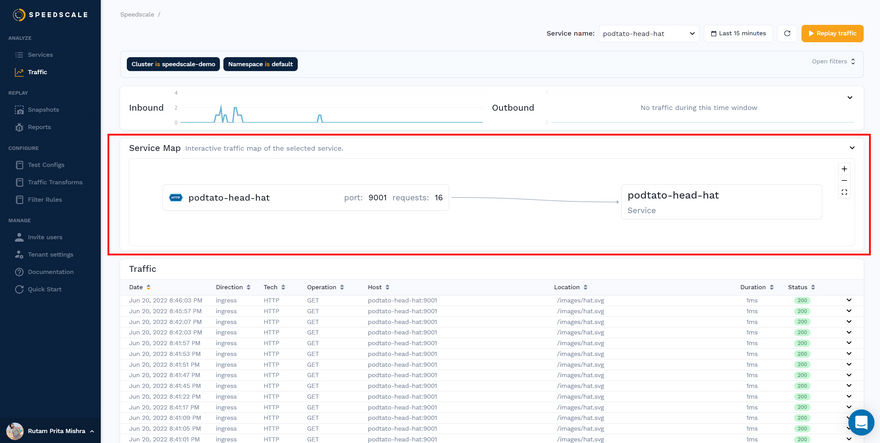
Step 4: Now if we click on the first item on the list which was marked in red above, then it will take us to the traffic distribution page for that specific service.
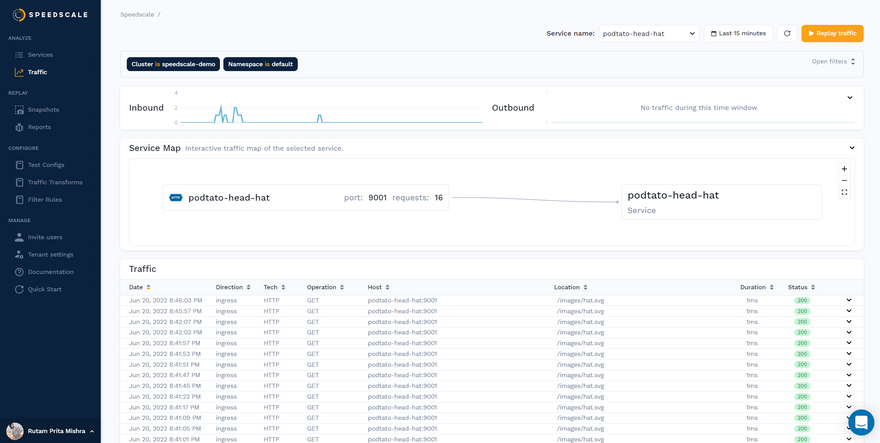
It gives a brief information about the kind of request, no of requests, the port and the service that it hits, as a part of its Service Map section.
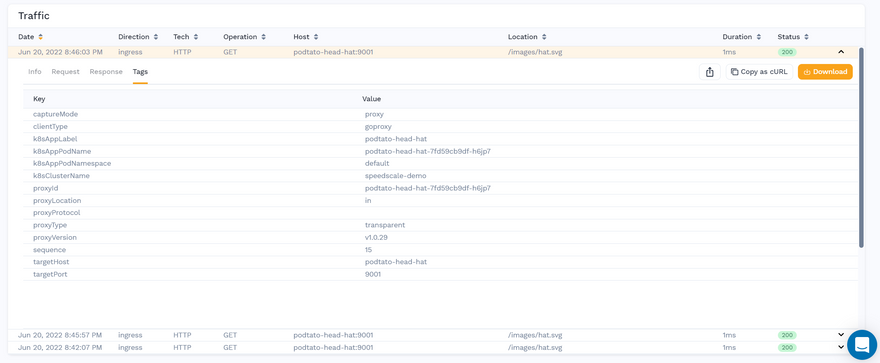
Also, it lists out all the traffic records below at its Traffic section and clicking on each of them further provides insights like the request headers, response body, info and tags.
Well, this is pretty much how we can load test the Podtato app and visualize its traffic using Speedscale.
Conclusion
We have now reached the end of this tutorial. In this tutorial, we created a cluster on Civo, installed Speedscale operator on it, deployed a demo app, patched it with the Speedscale operator and finally visualized the traffic after load testing.
Speedscale definitely does a great job in logging the traffic for all the patched services. The way it visualizes their traffic on the dashboard and the number of insights it provides for each of them is pretty impressive. Feel free to sign up for Speedscale and give it a spin with your own use-cases.
Lastly, show some love to this article if you really found this useful and don't forget to share your feedback as well.
Note: All the dashboard images used here are sole properties of Civo and Speedscale respectively, and are used here only for illustrative purposes.


Oldest comments (0)