
This is an excerpt from Chapter 4 of The Definitive Guide to Measuring Web Performance.
Now that you understand the metrics and the methods of measuring web performance, it's time to look at the tools!
How do you know what tool to use, what it measures, and how accurate the data is? This chapter will help.
These are some of the best web performance tools available. Each measures your website performance in different ways from different places. These measurements will not always line up, but by understanding what each tool is testing, you will get a more complete picture of how your website performs.
1. Google Lighthouse
Synthetic Lab Data
Lighthouse is an open-source tool from Google that can be run from Chrome DevTools or from the command line.
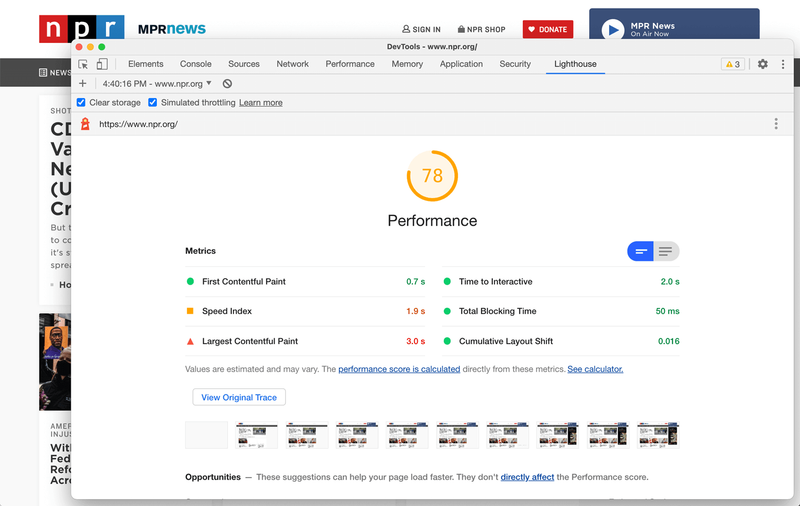
It's run from you local computer, so it's measuring the performance you experience with your hardware on your network. There are several places where you can run Lighthouse-as-a-Service from elsewhere on the internet, including Google's PageSpeed Insights. However these services have mixed results depending on the structure, location, and capacity of the service.
Lighthouse is most useful for development-time testing of your site or performing audits on sites where you don't have direct access (like snooping on what other websites are doing). Read more about the limitations of Lighthouse.
2. WebPageTest
Synthetic Lab Data
WebPageTest{:rel="nofollow"} is a free hosted service that performs performance tests on public websites. It can do a lot more things than Lighthouse, like setting up network locations, network speeds, and customizing requests.
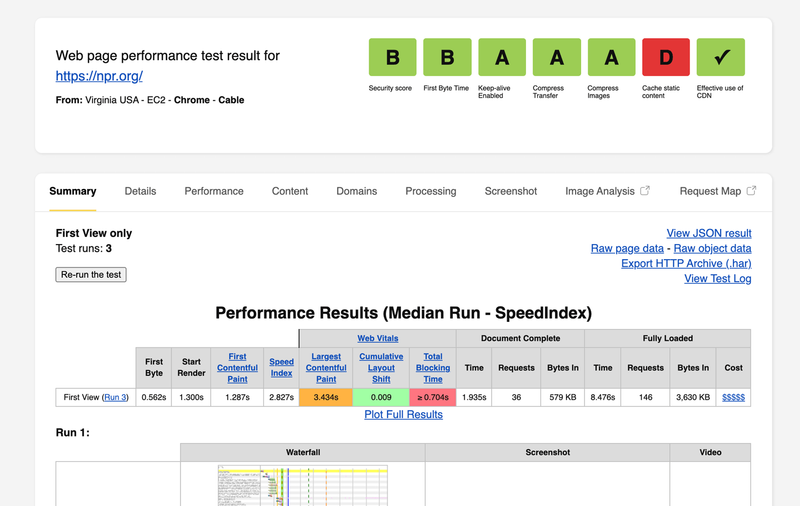
It also produces a more detailed (and more complex) report with network location, breakdown of timings, and a detailed waterfall chart.
WebPageTest is great for auditing live websites to better understand how they are performing in production.
3. Google Search Console
Synthetic Lab Data
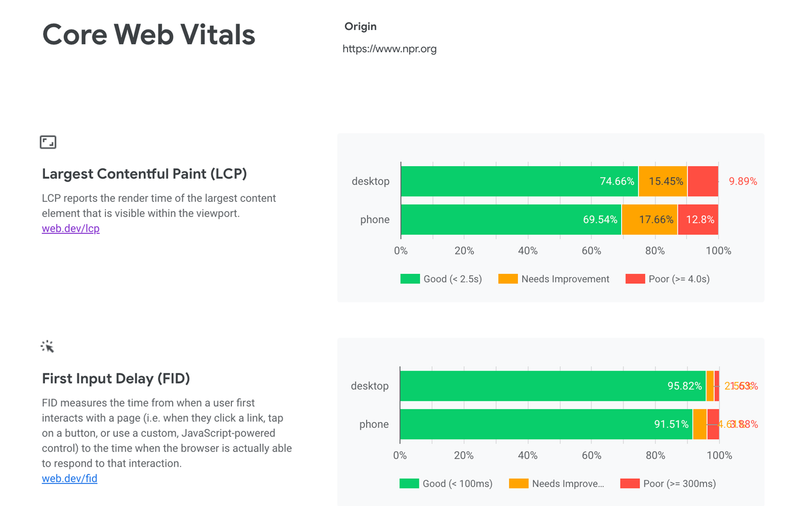
Google Search Console shows the analytics, issues, and performance recorded by the Googlebot crawler when Google indexes your website. This includes User Experience metrics like the Core Web Vitals.

Although the Search Console metrics are synthetic, they are what Google will use to rank your site in search results. They represent a very important user: Google.
The metrics you'll see in Search Console will be quite slow to update, depending on the traffic to your website. It could be a week or more for Google to see changes in your performance scores, and the reports are very generic.
You need to use Search Console to see how Google ranks your performance, but it's not very useful for testing or discovering performance issues.
4. Chrome User Experience Report (CrUX)
Real-User Field Data
The Chrome browser itself collects performance metrics from opt-in users for the top million domains on the internet. Google publishes these metrics in the Chrome User Experience Report or CrUX. It's real-user data!
The data is really interesting, but it's only published monthly and summarized to an entire domain. CrUX data is only accessible through BigQuery and DataStudio, Google's Data Warehouse tools. If you haven't used those tools before (like most people), it can be difficult to get meaningful information.
CrUX data is useful to see historical website performance, or compare your performance to other websites, but only if your website is large enough to qualify for inclusion.
5. Request Metrics
Real-User Field Data
Request Metrics is a real-user performance monitoring service. Unlike CrUX, Request Metrics shows you how your site is performing right now with no delay in the data.
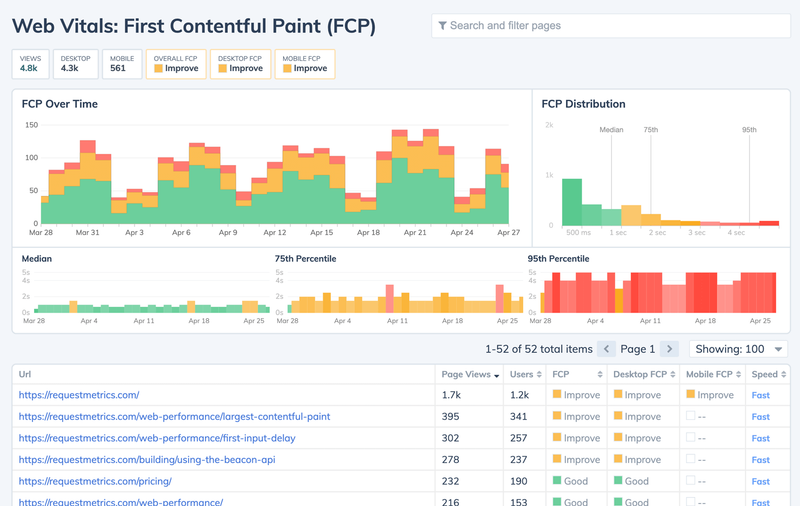
The charts are useful and easy to understand. The tool breaks down the large amount of data and gives you meaningful median, p75, and p95 metrics as well as some details on the causes of slowness.
Request Metrics is best for active monitoring of your website performance. It is really helpful when you are making performance changes to see how your improvements impact real users.

Top comments (2)
"Philadelphia property management" encompasses a range of services tailored to the needs of property owners in Philadelphia. From tenant acquisition and screening to rent collection and maintenance, these services ensure the efficient operation of residential and commercial properties.
By entrusting their properties to Philadelphia property management professionals, owners can enjoy peace of mind knowing that their investments are in capable hands.
With local expertise and a dedication to client satisfaction, Philadelphia property management companies strive to maximize property value and rental income while minimizing the hassle for property owners.
I'm glad you found this post helpful @15cullipool! I'm sure devs like you are exactly the kind of folks @toddhgardner had in mind when authoring this post.
Some comments have been hidden by the post's author - find out more