Introduction
One constant topic that comes up whenever discussing cloud costs with my counterparts in Finance is the notion of forecasting. Finance people love to forecast and it's a big part of their job. However, forecasting AWS spend is notoriously difficult for several reasons:
- The fact that cloud costs are consumption based and thus highly variable depending on usage.
- The complex nature of how AWS services are priced - usually along multiple dimensions.
Given these factors, cloud cost forecasting tends to be more of an art than a science, but there are some tools to help you along the way. One that can be useful is one your are probably already using, AWS Cost Explorer.
Solution
AWS Cost Explorer is Amazon's native tool for cost reporting and analysis. While it certainly isn't as powerful as many of the third party cost reporting tools that are available on the market, it's come a long way over the past couple years and is incredibly useful.
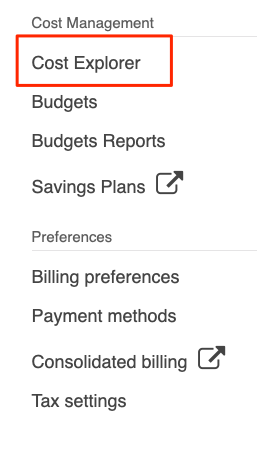
Cost Explorer is available to you inside the AWS Console. Simply type Cost Explorer in the search box, or if you are in the Billing console already, choose Cost Explorer from the left hand navigation bar.
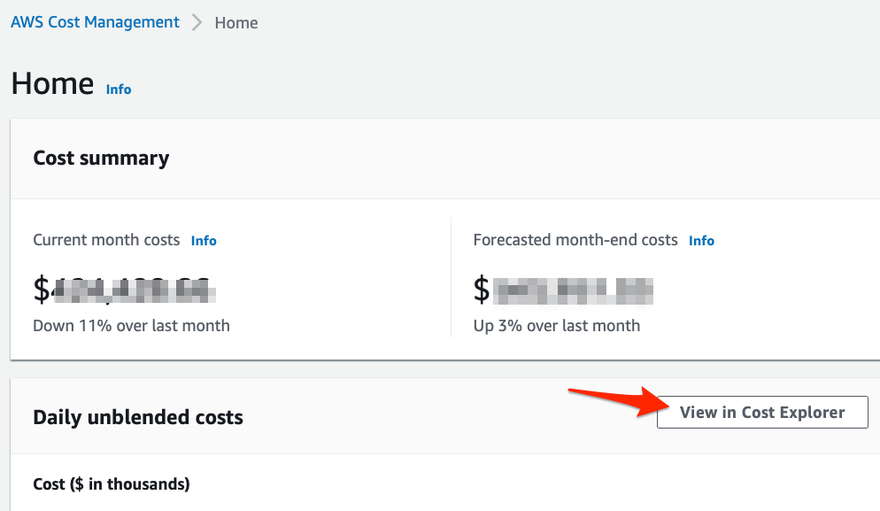
When you first land in Cost Explorer, you will be on the Cost Management home page. To actually start using the tool, you need to click one more time on the "View in Cost Explorer Button".
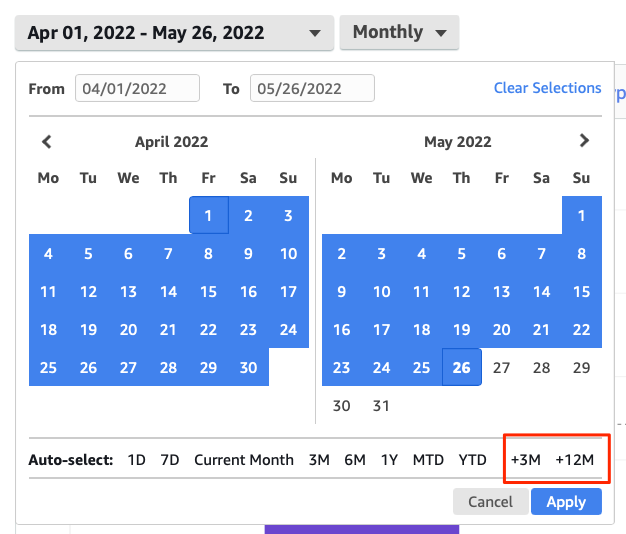
Now we are in Cost Explorer proper. To create a view that is showing you forecast, you need to add future months to the current report. To start with, we need to switch our granularity view from the default "Daily" view to "Monthly" view:
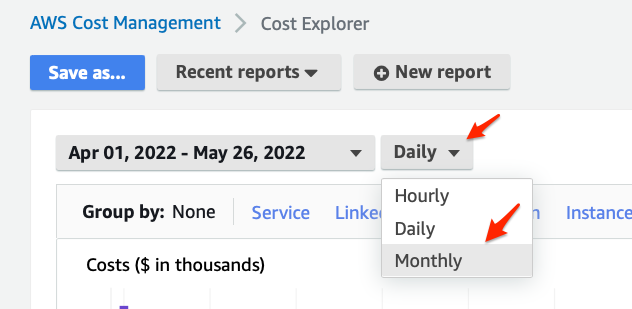
Once you are in the monthly view, click on the date picker menu and when the calendar view pops up, click on the +3M to add 3 future months or +12M to add 12 future months into to your report, the click Apply.
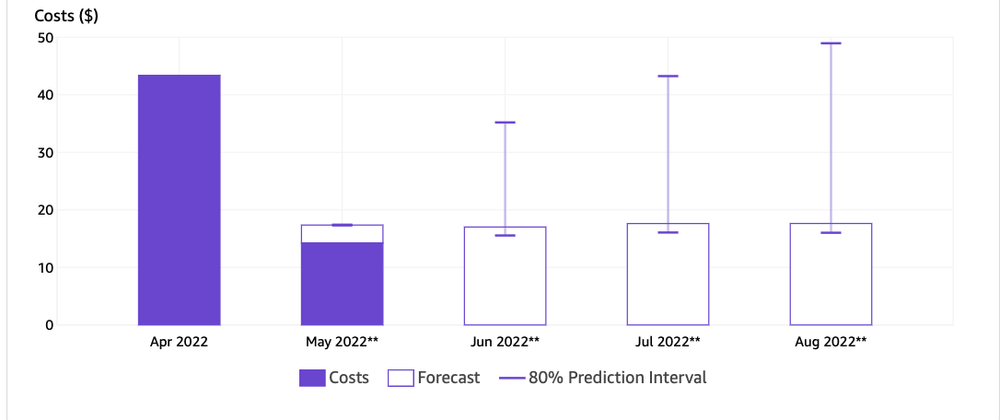
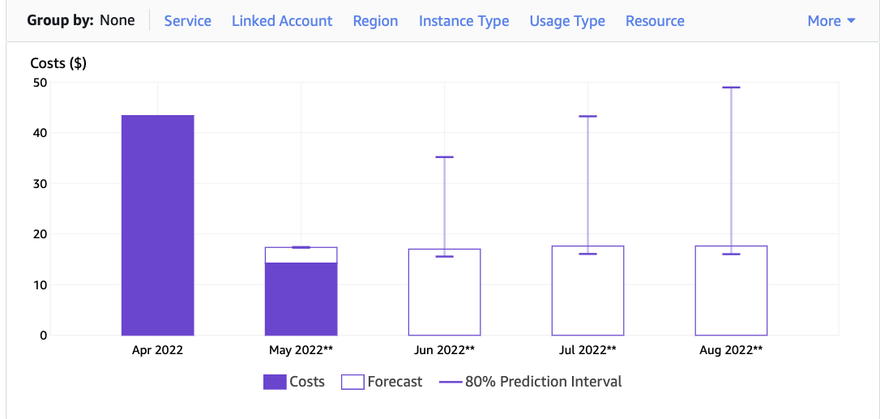
Your report will refresh and your graph will now show 3 or 12 months into the future. On a bar chart view the outlined box will show the forecasted spend for the month, while the vertical line with an upper and lower crossbar is showing you the 80% prediction interval for the forecast. The prediction interval is essentially the upper and lower bounds for the forecasted spend for that month. You will notice that the further you go out into the future, the bigger the confidence interval gets - and thus the less you should trust the forecast number to be accurate.
Like this view and want to come back to it in the future? Click the "Save As" button in the upper left and give the report a name like "Current Month+3 month forecast". This custom report will then always be available from the Reports menu on the left hand navigation bar in Cost Explorer.
Annoyances
The most annoying thing about the Cost Explorer forecast feature is that you cannot use the "Group by" feature with forecasting turned on. You can either Group By or Forecast, but not both. Thus, you have no way to see individual forecasts for each linked account or by billing tag for example. I hope they fix this someday as it would make the forecast feature a lot more useful.
Also, in my experience the Cost Explorer forecast tends to be a bit too high compared to where the spend lands for a given month. I think the ML engine they are using is a bit too aggressive, but sadly there is no tuning available. Still, the Cost Explorer forecast gives you a good place to start and then that's where the art of forecasting comes in.
Conclusion
In this post, I've shown you how to use Cost Explorer to view a spending forecast for your AWS Account or Organization. Hope you've found this useful, and if you have any suggestions for improvement or questions, add them in the comments!

Latest comments (0)