I will write about VictoriaMetrics Cloud itself separately, but now I want to check how you can write CloudWatch Metrics via AWS Firehose to VictoriaMetrics Cloud.
In fact, the AWS Data Firehose service itself allows you to transfer streaming data from various sources to Amazon services such as AWS S3, Redshift, Open Search, or to external services such as Datadog, New Relic, etc.
Recently, VictoriaMetrics launched (Beta yet) its own support for AWS Data Firehose, and now we can stream data to VictoriaMetrics Cloud.
The nice thing about this setup is that we don’t actually need to run any servers or exporters to collect metrics ourselves — everything is completely agentless and serverless, because Data Firehose is an AWS Managed service that just works, and VictoriaMetrics Cloud runs entirely on the VictoriaMetrics infrastructure and doesn’t require any special configuration from us.
Another interesting thing is that CloudWatch sends metrics and VictoriaMetrics receives them in OpenTelemetry format, although VictoriaMetrics can convert them to Prometheus format.
Here’s what we’re going to do:
- configure AWS Data Firehose Stream to transfer data to VictoriaMetrics Cloud
- set up CloudWatch Metrics Stream to transfer metrics to this Firehose Stream
VictoriaMetrics Cloud Authentication
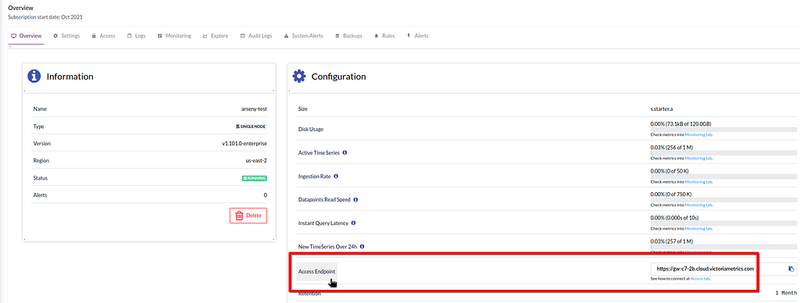
The first thing to do is to get the URL of the endpoint to which the data will be sent.
In VictoriaMetrics Cloud, we have a created Deployment (see Creating deployments), in the Overview of which we have the Access Endpoint parameter:
The second is we need is to get an Access Token (see Start writing and reading data).
Go to the Access tab, where we have a token with read-write permissions:
Now we have two parts that we will use in AWS Firehose:
-
HTTP Endpoint URL:
https://gw-c7-2b.cloud.victoriametrics.com -
Bearer Access Token:
ccbd4c8e-db49-463f-9813-371a09e549b6
We will write from CloudWatch to VictoriaMetrics in the OpenTelemetry format, so the full endpoint will be with the /opentelemetry/api/v1/push URI - https://gw-c7-2b.cloud.victoriametrics.com/opentelemetry/api/v1/push.
Creating AWS Data Firehose Stream
Everything is quite simple here: we need to set a Source, that is, where and what data will come from, and specify a Destination, i.e. where to send this data.
If necessary, you can do transformations with AWS Lambda, but in the case of CloudWatch metrics, this is not necessary.
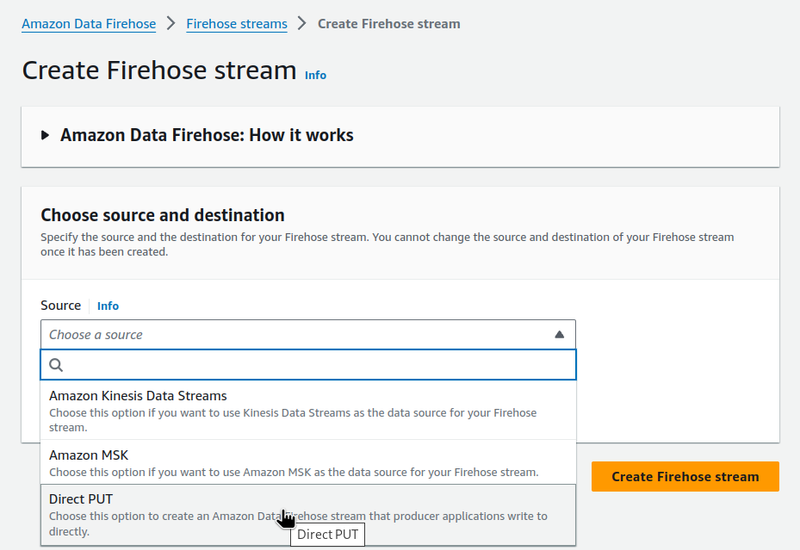
So, go to Amazon Data Firehose, click Create Firehose stream:
In the Source field, select Direct PUT:
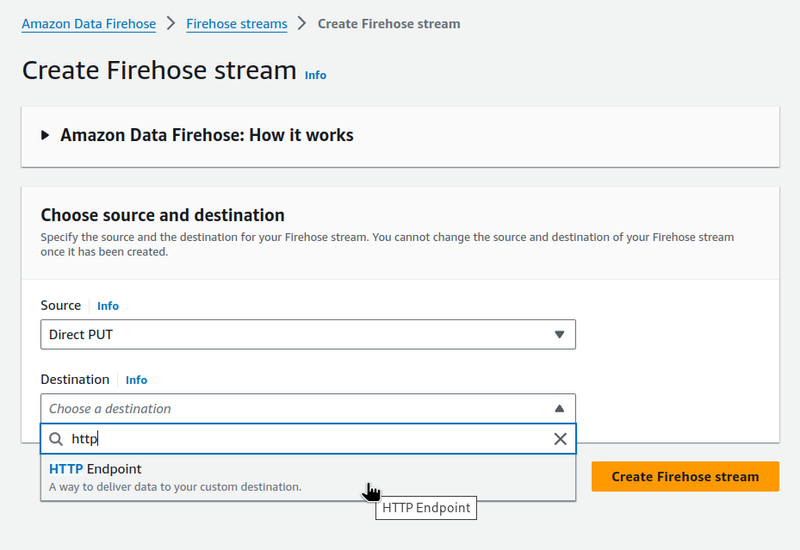
In the Destination — choose HTTP Endpoint:
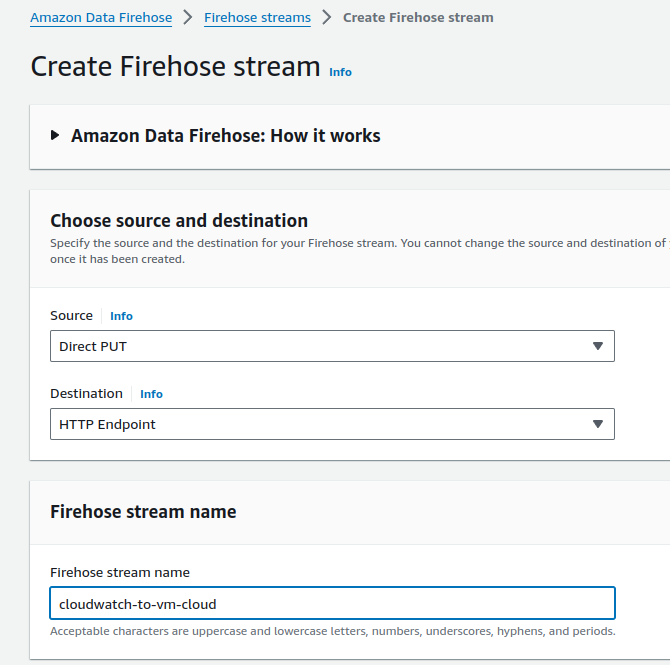
Set the Firehose stream name:
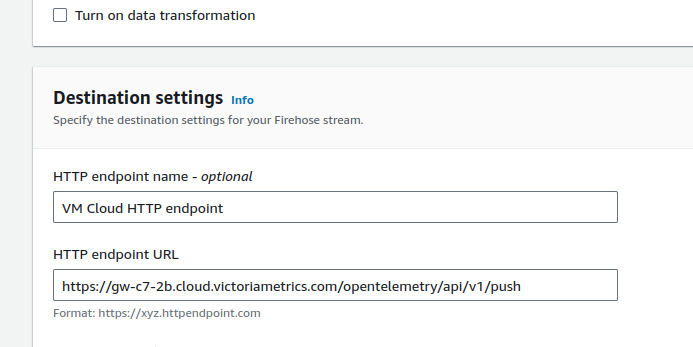
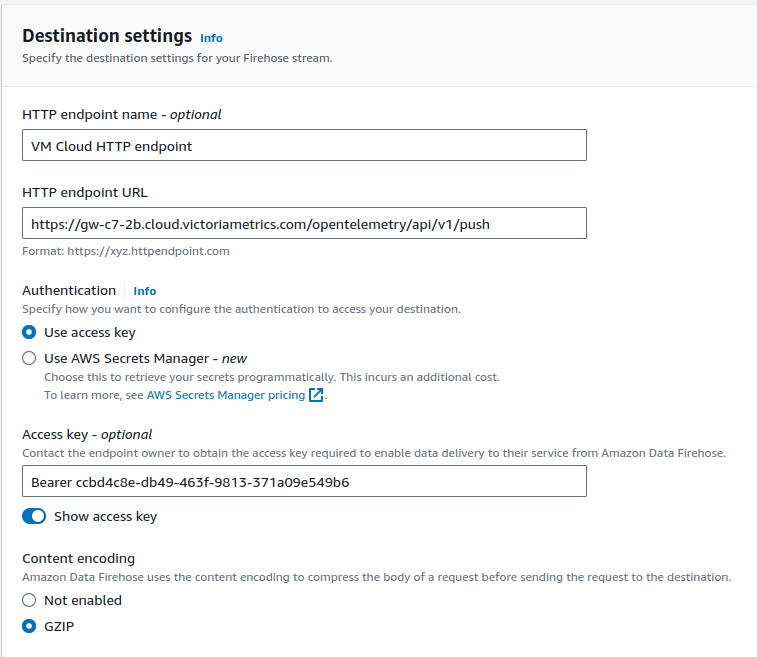
In Destination settings — specify the HTTP endpoint URL that was received in VictoriaMetrics Cloud + /opentelemetry/api/v1/push:
The authentication token is set in the Access key in the format Bearer TOKEN_VALUE:
Optionally, you can enable the GZIP compression for the data sent to the VictoriaMetrics.
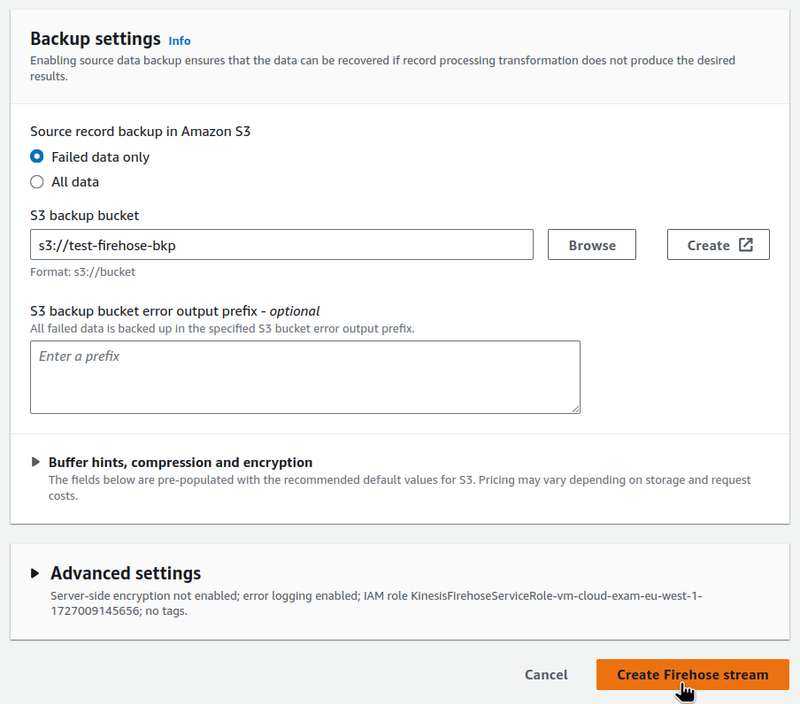
Firehose needs to configure a Backup storage for the data that it could not send to the Destination — see Handle data delivery failures.
Set the name of an AWS S3 bucket:
Save the new stream — it is ready to receive data.
CloudWatch Metrics to AWS Data Firehose
Documentation — Custom setup with Firehose.
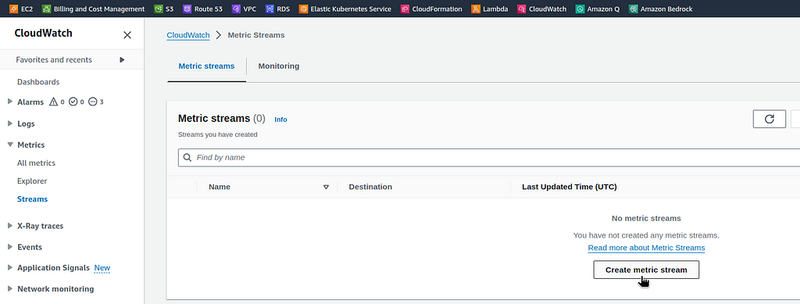
Go to the CloudWatch > Metrics > Streams, click Create metric stream:
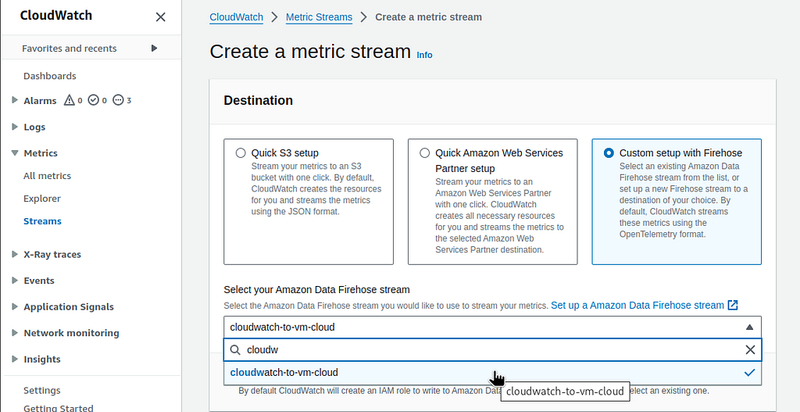
Choose the Custom setup with Firehose, select the stream created above:
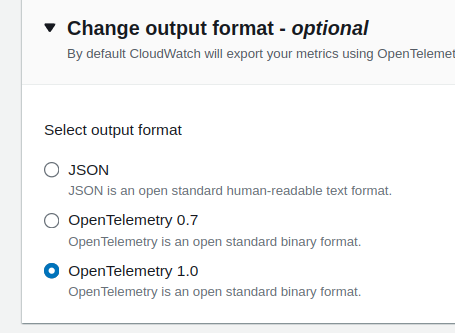
If necessary, you can choose a format, but the default OpenTelemetry 1.0 is supported:
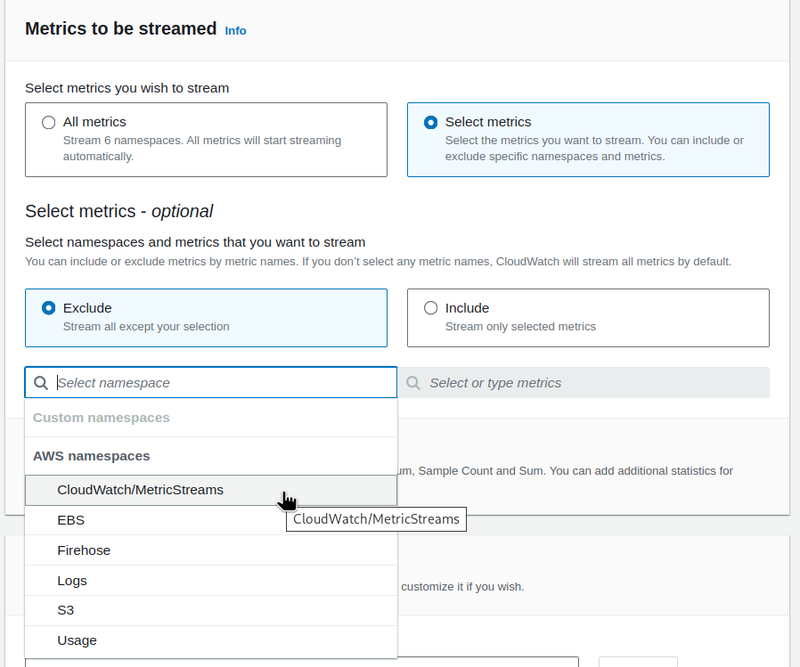
Choose which CloudWatch metrics you want to send — all of them or only selected ones:
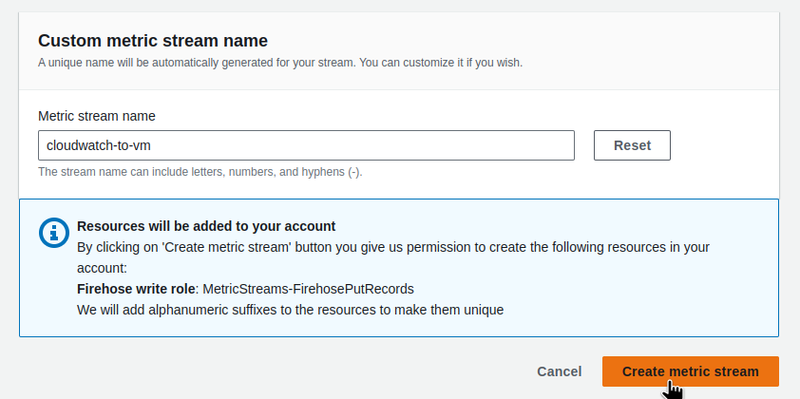
The last step is to set the stream name:
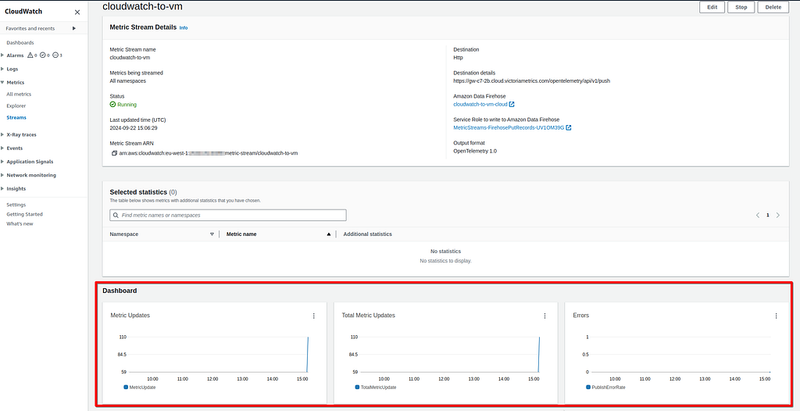
Check that the stream has Status == Running:
Testing Firehose Stream
Now we have a CloudWatch Metrics Stream that writes metrics to the Firehose Stream, which then sends them to the HTTP Endpoint in the VictoriaMetrics Cloud.
Wait ~5 minutes, and first check the metrics in the CloudWatch Metrics Stream:
If there are metrics here, then go to Firehose Stream > Monitoring, where you should see that the data is going to VictoriaMetrics Cloud:
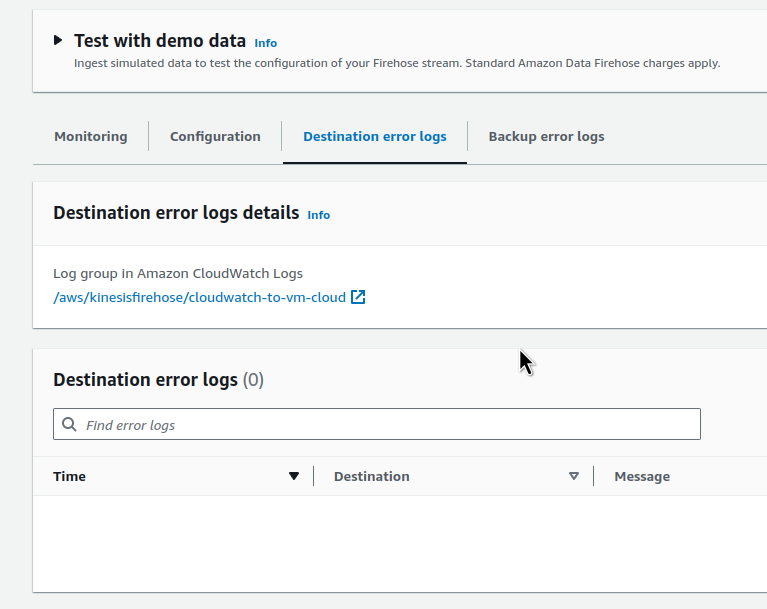
If you have problems sending data, see the Destination error logs tab:
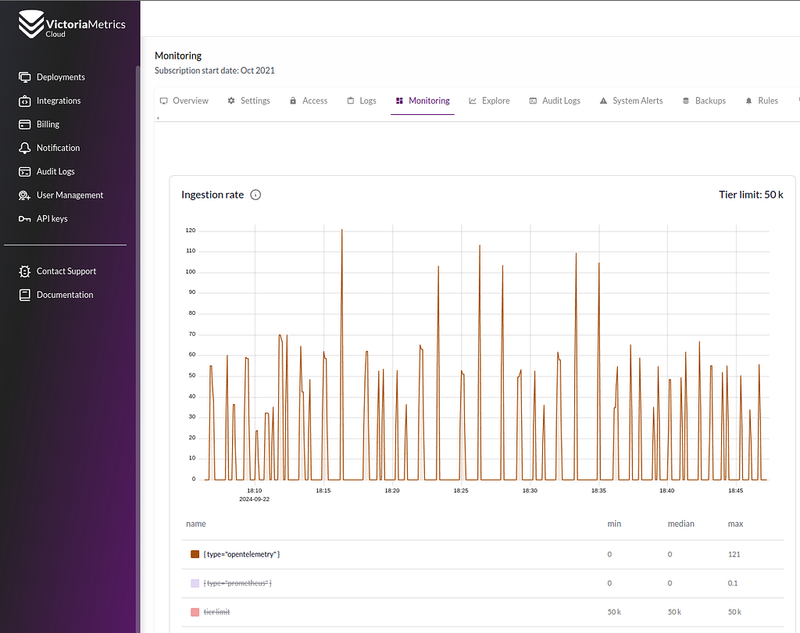
You can also check the Monitoring tab in VictoriaMetrics — the Ingestion rate graph should contain requests with {type="opentelemetry" }:
VictoriaMetrics Explore and CloudWatch Metrics
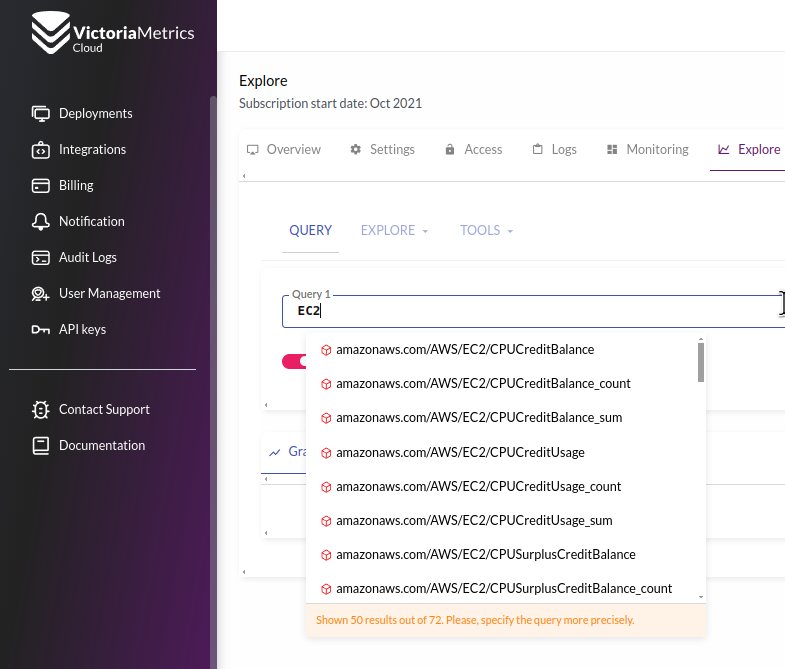
Turn on Autocomplete in the VictoriaMetrics Explore, and you should get a list of metrics that come from AWS CloudWatch:
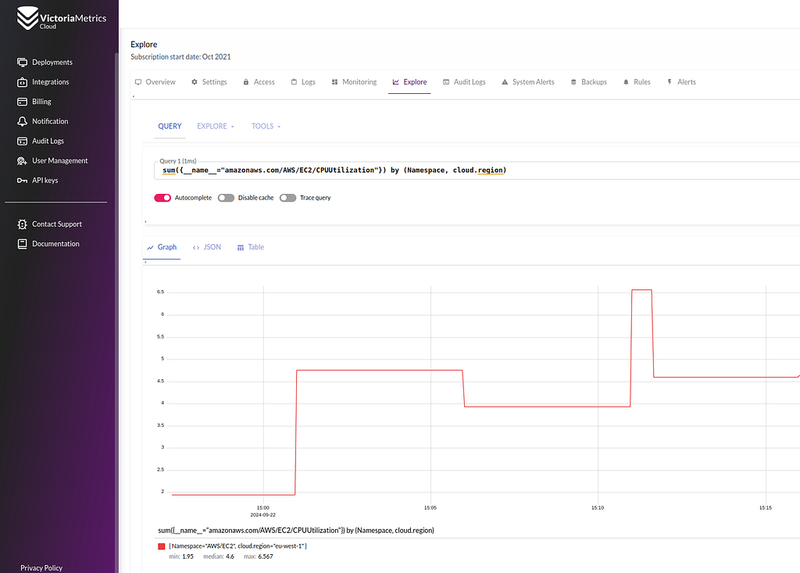
And then we can make queries, for example, using the __name__ label:
sum({ __name__ ="amazonaws.com/AWS/EC2/CPUUtilization"}) by (Namespace, cloud.region)
To switch the metrics format from OpenTelemetry to Prometheus, go to Settings > Advanced Settings and add the -opentelemetry.usePrometheusNaming parameter:
Done.
Originally published at RTFM: Linux, DevOps, and system administration.








Top comments (0)