We have a function in AWS Lambda, that is writing logs to CloudWatch Logs, from where with the lambda-promtail we are getting them to a Grafana Loki instance to use them in Grafana graphs.
What the task is: in the logs, we have records about “Init duration” and “Max Memory Used” by Lambdas.
There are no such metrics in CloudWatch, but we are interested in having a graph of this data because it can be a sign of a cold start, which we want to monitor.
So we need:
- get this data and use it as values in the graph
- build a graph where milliseconds per function’s run will be displayed on the left, and how much memory was used — on the right
Grafana Loki, and values from labels
So what can we do:
- select a log file of the desired function with the steam selector
- through a log filter, select records that contain the “Init Duration” string
- with the regex log parser, we can get the value from the Max Memory Used or Init duration, and create a new label with this value
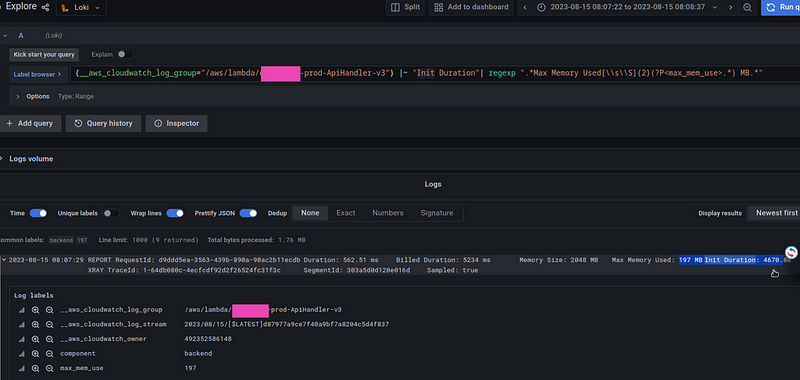
That is, to create a label, max_mem_use the entire request will be as follows:
{__aws_cloudwatch_log_group="/aws/lambda/app-prod-ApiHandler-v3"} |~ "Init Duration"| regexp ".*Max Memory Used[\\s\\S]{2}(?P<max_mem_use>.*) MB.*"
Okay, we got the label — next we need to build a graph, that is, create a metric query and use the value from the label max_mem_use as the graph's value.
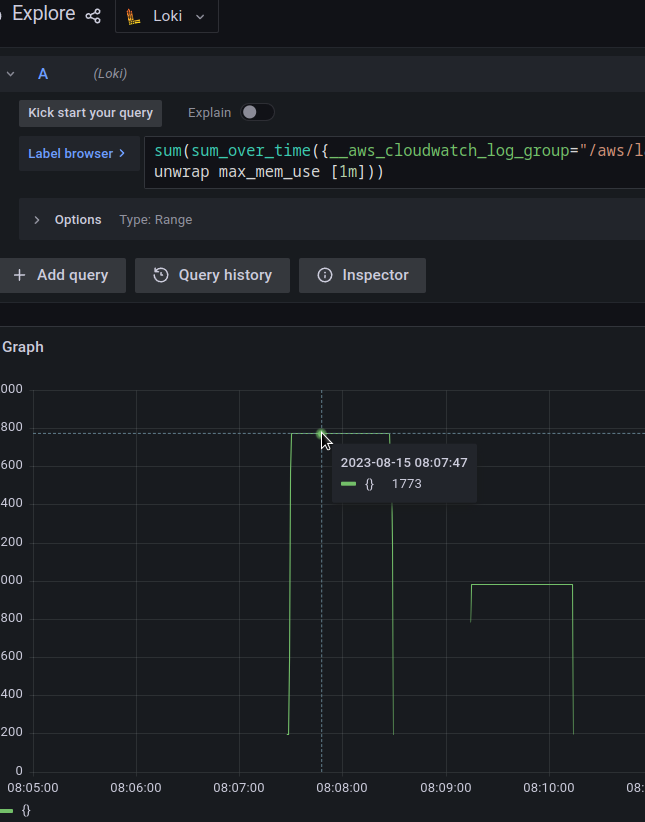
To do this we can use the unwrap expression, and specify the name of the label, the value of which we want to display:
sum(sum_over_time({__aws_cloudwatch_log_group="/aws/lambda/app-prod-ApiHandler-v3"} |= "Init Duration"| regexp ".*Max Memory Used[\\s\\S]{2}(?P<max_mem_use>.*) MB.*" | unwrap max_mem_use [15m]))
And we get the sum of all entries in the log file — between 08:07:28 and 08:08:29 we have a total of 1773 megabytes:
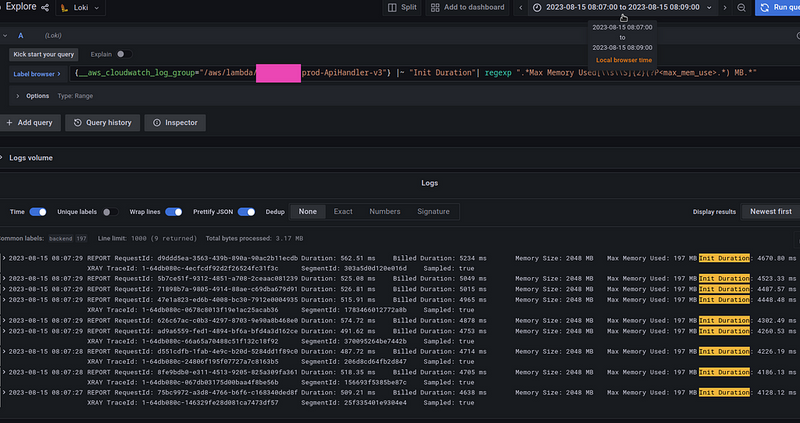
Check in the logs — select the entries for this interval, 08:07:00 and 08:09:00:
We have 9 records, each of 197 megabytes — a total of 1773.
Grafana panel, and dual-Y-axes
In Grafana graphs, it is possible to display the results of two queries on different axes and with different locations on one graph.
That is, on the left side of the Y (vertical) axis output some values, and on the right of the Y axis — another, and on the X (horizontal) axis — a third, usually, here is the timeline.
However, configuring this is not so obvious, and attempts to google lead to the post Learn Grafana: How to use dual axis graphs for the 2020 year which is outdated, because now it is done through Overrides.
So, we have a graph with two queries:
Next, we want to display the Init Duration in milliseconds on the left as Unit > milliseconds, and the Memory Used on the right as Unit > megabytes.
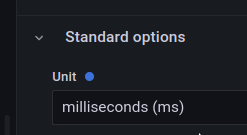
It’s quite simple with the Init Duration — just configure the Standard options > Unit > ms:
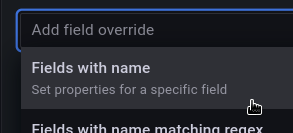
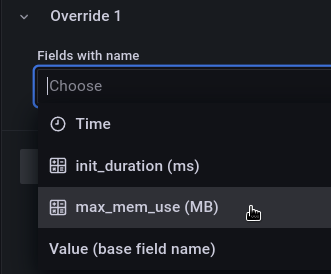
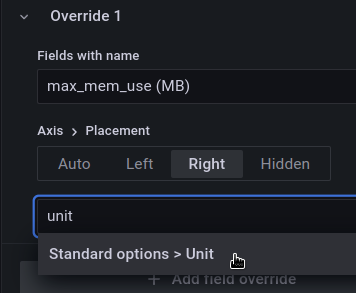
But for Memory — go to the Overrides, and add new parameters for the field max_mem_use:
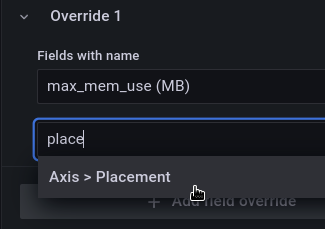
In Property, select Axis > Placement:
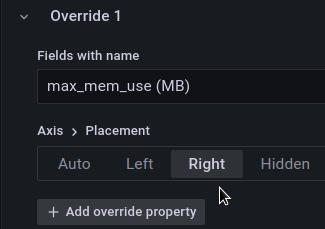
And set the value Right:
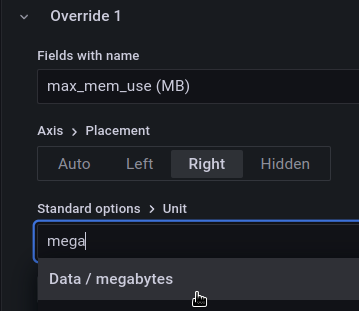
Next, to display the unit as megabytes, add a second Override property — Unit:
And set the megabytes value:
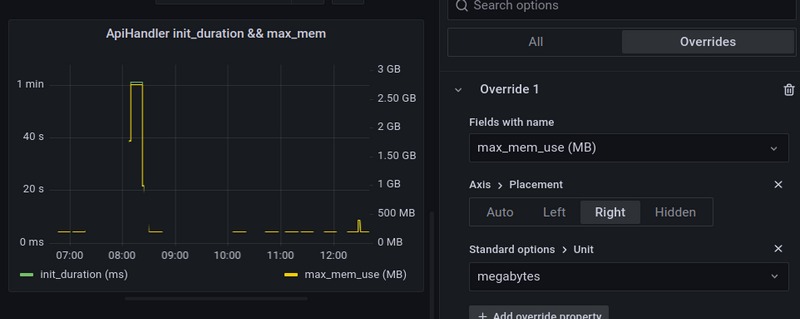
Now, on the graph on one side we have the function’s launch time, and on the other — how much memory it consumed, and we can see the correlation between these values:
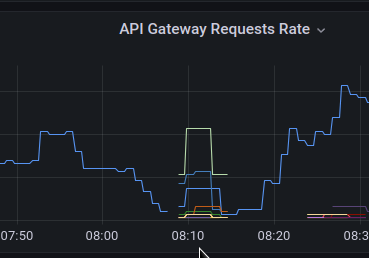
The only thing is that these data still do not exactly help with the finding of cold starts, since during this period there were just many requests to API Gateway > Lambda, and it was launched in several instances — that is why we have a spike on the Init duration and Memory graphs:
Therefore, it is necessary to update it a bit: requests from Loki to Recording Rules, and write them in the form of the common metrics in Prometheus/VictoriaMetrics, and in the query divide the value obtained from Loki’s string by the number of records received from the log during this period.
Add two Recording Rules:
- name: Backend-Lambda

  rules:

  - record: aws:backend:lambda:init_duration:ms
    expr: sum(sum_over_time({__aws_cloudwatch_log_group=~"/aws/lambda/app-(dev|staging|prod)-ApiHandler-v3"} |= "Init Duration"| regexp ".*Init Duration[\\s\\S]{2}(?P<init_duration>.*) ms.*" | unwrap init_duration [15m])) by (__aws_cloudwatch_log_group)
          /
          sum(count_over_time({__aws_cloudwatch_log_group=~"/aws/lambda/app-(dev|staging|prod)-ApiHandler-v3"} |= "Init Duration" [15m])) by (__aws_cloudwatch_log_group)

  - record: aws:backend:lambda:max_mem_use:mb
    expr: sum(sum_over_time({__aws_cloudwatch_log_group=~"/aws/lambda/app-(dev|staging|prod)-ApiHandler-v3"} |= "Init Duration" | regexp ".*Max Memory Used[\\s\\S]{2}(?P<max_mem_use>.*) MB.*" | unwrap max_mem_use [15m])) by (__aws_cloudwatch_log_group)
          /
          sum(count_over_time({__aws_cloudwatch_log_group=~"/aws/lambda/app-(dev|staging|prod)-ApiHandler-v3"} |= "Init Duration" [15m])) by (__aws_cloudwatch_log_group)
In the second part of the request, through the count_over_time we are getting the total number of records that were received.
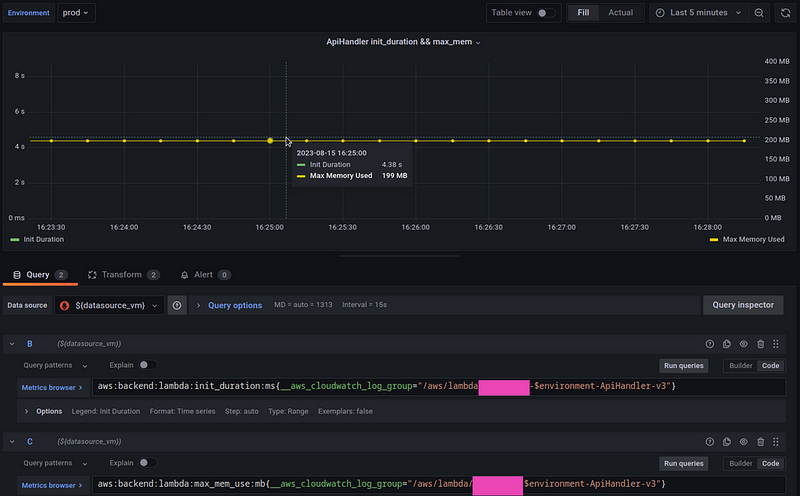
Update the Query in Grafana:
aws:backend:lambda:init_duration:ms{__aws_cloudwatch_log_group="/aws/lambda/app-$environment-ApiHandler-v3"}
And:
aws:backend:lambda:max_mem_use:mb{__aws_cloudwatch_log_group="/aws/lambda/app-$environment-ApiHandler-v3"}
And now we have more correct data:
Done.
Originally published at RTFM: Linux, DevOps, and system administration.




Top comments (1)
Grafana is great for showing logs with data from Loki. It helps you view important numbers and patterns clearly. Using dual-Y-axes lets you compare two sets of data at once, making it easier to understand.