So, we have Loki installed from the chart in simple-scale mode, see Grafana Loki: architecture and running in Kubernetes with AWS S3 storage and boltdb-shipper.
Loki is runnings on an AWS Elastic Kubernetes Service cluster, installed with Loki Helm chart, AWS S3 is used as a long-term store, and BoltDB Shipper is used to work with Loki indexes.
In Loki 2.8, for indexes, the TSDB mechanism appeared, which will probably soon replace BoltDB Shipper, but I have not tried it yet. See Loki’s new TSDB Index.
And in general, everything works, and everything seems fine, but when receiving data for a week or a month in Grafana, we very often get errors 502/504 or “ too many outstanding requests “.
So today we’ll take a look at how you can optimize Loki for better performance.
In fact, I’ve spent a lot of time trying to sort through more or less everything that’s going to be in this post, because Loki’s documentation… It is. There is a lot of it. But it is quite difficult to understand from this documentation some implementation details, or how different components work with each other in places.
Although I disagree with the main thesis of I can’t recommend serious use of an all-in-one local Grafana Loki setup, but I do agree that:
In general I’ve found the Loki documentation to be frustratingly brief in important areas such as what all of the configuration file settings mean and what the implications of setting them to various values are.
Nevertheless, if you still spend a little time on “combing”, then, in general, the system works very well (at least until we have terabytes of logs per day, but I have come across discussions where people have such loads).
So, what can we do to speed up the workflow for handling requests in Grafana dashboards and/or alerts from logs:
- optimization of requests
- use Record Rules
- enabling caching of queries, indexes and chunks
- optimize the work of Queries
Let’s go.
Loki Pods && Components
Before starting optimization, let’s remember what Loki has and how it all works together.
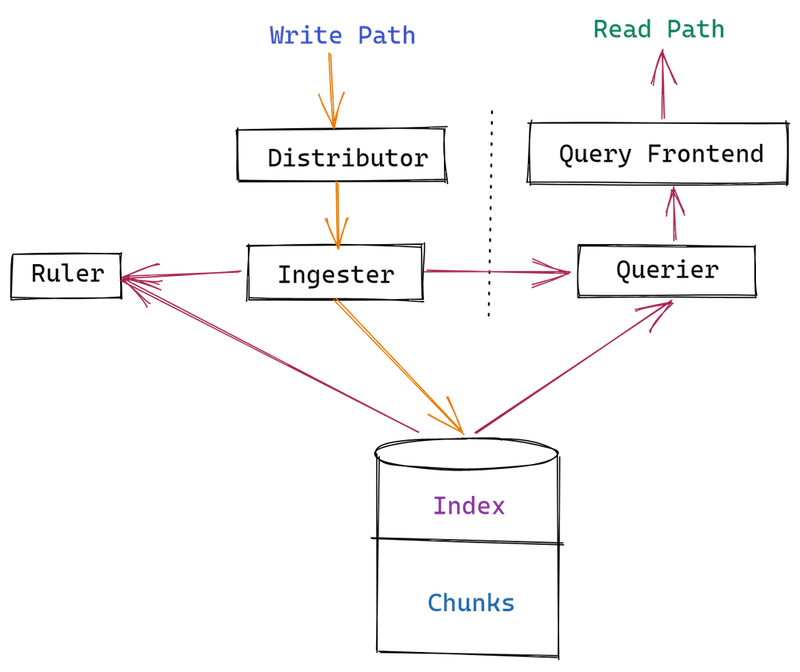
So, we have the following components:
That’s it, we deploy the Loki Helm chart in the simple-scale mode and without the legacyReadTarget option enabled, we’ll have four Pods — the Read, Write, Backend та Gateway:
- Read :
- querier: processes data requests — first tries to get data from the Ingester, if it is not there — it goes to the long-term store
- query frontend: an optional service to improve the speed of Querier work: data requests first go to Query Frontend, which breaks large queries into smaller ones and creates a queue of queries, and Querier takes requests from this queue for processing. In addition, the Query Frontend can perform caching of responses and parts of queries are processed from its cache instead of executing this query on a worker, i.e. Querier
- query scheduler: an optional service to improve the scaling of Querier and Query Frontend, which takes over the formation of a queue of queries and forwards them to several Query Frontends
- ingester: in the Read-path responds to requests from Querier with the data it has in memory (those that have not yet been sent to the long-term store)
- Write :
- distributor: accepts incoming logs from clients (Promtail, Fluent Bit, etc), checks them, and sends them to Ingester
- ingester (again): receives data from the Distributor, and forms chunks (blocks of data, or fragments), which it sends to a long-term store
- Backend :
- ruler: checks data in logs against expressions specified in rulers and generates alerts or metrics in Prometheus/VictoriaMetrics
- compactor: responsible for compression of index files and retention of data in a long-term storage
- Gateway : just an Nginx service that is responsible for routing requests to the appropriate Loki services
Table Manager, BoltDB Shipper, and indexes
It is worth mentioning the creation of indexes.
First of all, the Table manager, because personally, from its documentation it was not clear to me whether it is used now or not. Because on the one hand in values.yaml it has enabled=false, on the other - in the logs of Write-instances it appears here and there.
So, what do we have about indexes:
- Table Manager is already deprecated, and is used only if indexes are stored in external storage — DynamoDB, Cassandra, etc
- index files are created by Ingester in the directory
active\_index\_directory(by default/var/loki/index) when chunks from memory are ready to be sent to long-term storage - see Ingesters - the mechanism
boltdb-shipperis responsible for sending indexes from Ingester instances to the long-term store (S3)
Loki queries optimization
I’ve checked out the Best practices blog post on the Grafana website, and tried the recommendations in practice, but didn’t really see a valuable difference.
Still, I will add it here briefly, because in general, they look quite logical.
I’ve checked the time using requests like:
$ time logcli query '{app="loki"} |="promtail" | logfmt' --since=168h
And the execution time was still very different even when executing the same query, regardless of attempts to optimize the query by using selectors or filters.
Label or log stream selectors
Unlike ELK, Loki does not index all text in logs, but only timestamps and labels:
So a request in the form {app=~".\*"} will take longer than when using the exact stream selector, i.e. {app="loki"}.
The more accurately the stream selector is used — the less data Loki will have to unload data from the long-term store and process for the response — the query {app="loki", environment="prod"} will be faster than simply selecting all streams from {app="loki"}.
Line Filters and regex
Use Line filters and avoid regular expressions in queries.
That is, a query {app="loki"} |= "promtail" will be faster than just {app="loki"}, and faster than {app="loki"} |~ "prom.+".
LogQL Parsers
Parsers by the speed of work:
- pattern
- logfmt
- JSON
- regex
Don’t forget about the Log Filter: a query {app="loki"} |= "promtail" | logftm will be faster than {app="loki"} | logfmt.
And now we can move on to the Loki parameters, which will allow us to speed up the processing of requests and reduce the use of CPU/Memory by its components.
Ruler and Recording Rules
The Recording Rules gave a very good boost.
In general, the Ruler turned out to be much more interesting than just executing requests for alerts.
It’s great for any kind of query, because we can create a Recording Rule and send the results to Prometheus/VicrtoriaMetrics via the remote\_write, and then run queries for alerts or Grafana dashboards directly from Prometheus/VicrtoriaMetrics instead of running them in Loki every time, and it works much faster than writing the request in Grafana panels or an alert rule in the Ruler config file.
So, to save the results in Prometheus/VicrtoriaMetrics — in the Ruler parameters add the WAL directory where the Ruler will write the results of requests, and configure remote\_write where it will save the results of requests:
...
    rulerConfig:
      storage:
        type: local
        local:
          directory: /var/loki/rules
      alertmanager_url: [http://vmalertmanager-vm-k8s-stack.dev-monitoring-ns.svc:9093](http://vmalertmanager-vm-k8s-stack.dev-monitoring-ns.svc:9093)
      enable_api: true
      ring:
        kvstore:
          store: inmemory
      wal:
        dir: /var/loki/ruler-wal
      remote_write:
        enabled: true
        client:
          url: [http://vmsingle-vm-k8s-stack.dev-monitoring-ns.svc:8429/api/v1/write](http://vmsingle-vm-k8s-stack.dev-monitoring-ns.svc:8429/api/v1/write)
...
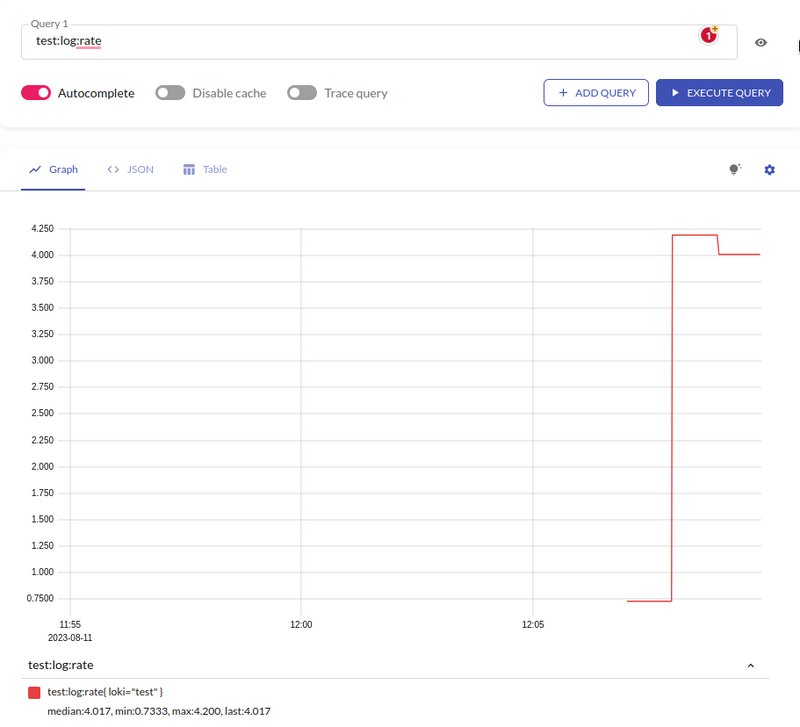
And in a minute check the metric in VicrtoriaMetrics:
In Grafana, the result of graphing speed is really impressive.
If the request:
sum(
  rate({__aws_cloudwatch_log_group=~"app-prod-approdapiApiGatewayAccessLogs.*"} | json | path!="/status_monitor" | status!~"200" [5m])
)
by (
  status, __aws_cloudwatch_log_group
)
Save as Recording Rule as:
- record: overview:backend:apilogs:prod:sum_rate
  expr: |
  sum(
    rate({__aws_cloudwatch_log_group=~"app-prod-appprodapiApiGatewayAccessLogs.*"} | json | path!="/status_monitor" | status!~"200" [5m])
)
by (
  status, __aws_cloudwatch_log_group
)
  labels:
    component: backend
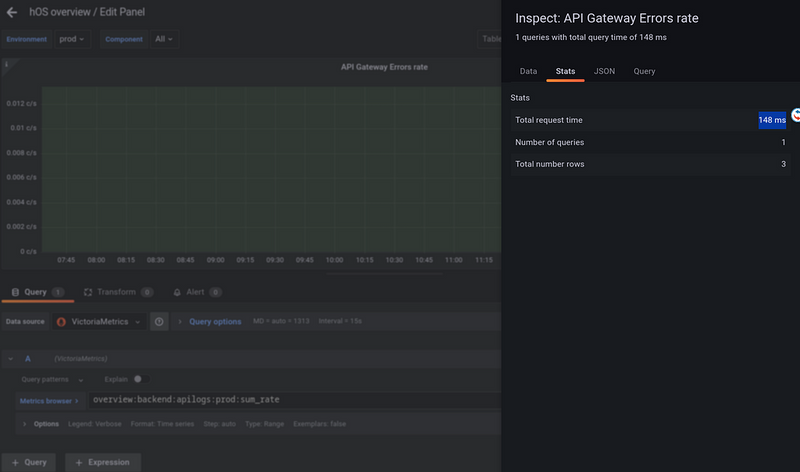
The speed of its execution in the dashboard is 148 ms :
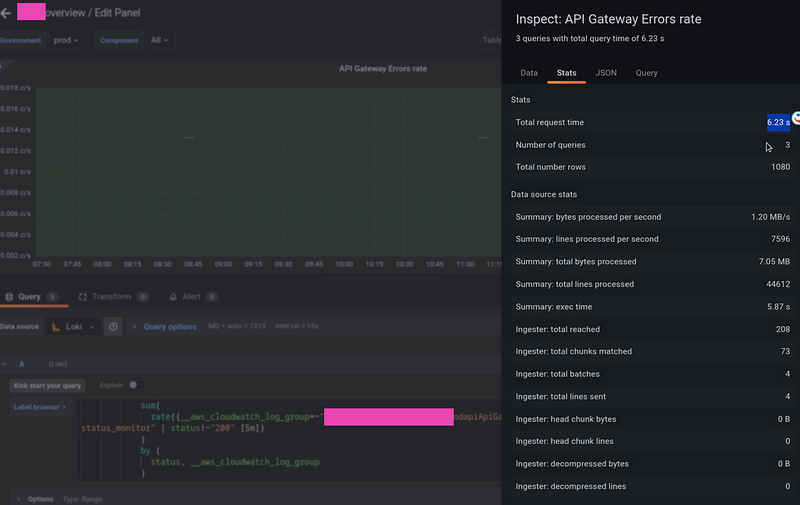
But if make the same request directly from a dashboard, sometimes it takes a few seconds:
Caching
Loki can store data in a cache to then return data from memory or disk, rather than performing a query from scratch and downloading index files and data blocks from S3.
It also gave quite a noticeable result in the speed of execution of requests.
Documentation — Caching.
Loki has three types of cache:
-
Index Cache :
boltdb-shippercan keep indexes for Queriers locally to avoid downloading them from S3 each time, see Queriers - Query results cache : store query results in the cache
- Chunk cache : store data from S3 in the local cache
What do we have in the parameters? See Grafana Loki configuration parameters for all:
-
query\_range: options to split large requests into smaller ones and cache requests in Loki query-frontend -
cache\_results: set to true -
results\_cache: backend cache settings -
boltdb\_shipper: -
cache\_location: a path to store BoltDB indexes for use in queries -
storage\_config: -
index\_queries\_cache\_config: index caching options -
chunk\_store\_config: -
chunk\_cache\_config: backend cache settings
Query та Chunk cache
Documentation — Caching.
In the values Helm chart, we already have a block formemcached - you can take it as an example.
For cache, we can use the embedded\_cache, Memcached, Redis, or fifocache (deprecated - now it is embedded\_cache).
Let’s try with Memcached because I’ve already used Redis in Kubernetes and don’t want to do this again
Add the repository:
$ helm repo add bitnami https://charts.bitnami.com/bitnami
Install a Memcached instance for the chunks cache:
$ helm -n dev-monitoring-ns upgrade --install chunk-cache bitnami/memcached
And for the queries results:
$ helm -n dev-monitoring-ns upgrade --install results-cache bitnami/memcached
Find Memcached’s Services:
$ kk -n dev-monitoring-ns get svc | grep memcache
chunk-cache-memcached ClusterIP 172.20.120.199 <none> 11211/TCP 116s
results-cache-memcached ClusterIP 172.20.53.0 <none> 11211/TCP 86s
Update the values of our chart:
...
loki:
  ...
  memcached:
    chunk_cache:
      enabled: true
      host: chunk-cache-memcached.dev-monitoring-ns.svc
      service: memcache
      batch_size: 256
      parallelism: 10
    results_cache:
      enabled: true
      host: results-cache-memcached.dev-monitoring-ns.svc
      service: memcache
      default_validity: 12h
...
Deploy and check the config in Loki Pods:
$ kk -n dev-monitoring-ns exec -ti loki-write-0 -- cat /etc/loki/config/config.yaml
…
chunk_store_config:
chunk_cache_config:
memcached:
batch_size: 256
parallelism: 10
memcached_client:
host: chunk-cache-memcached.dev-monitoring-ns.svc
service: memcache
…
query_range:
align_queries_with_step: true
cache_results: true
results_cache:
cache:
default_validity: 12h
memcached_client:
host: results-cache-memcached.dev-monitoring-ns.svc
service: memcache
timeout: 500ms
…
Let’s check whether the data went to Memcached — install telnet:
$ sudo pacman -S inetutils
Open the port:
$ kk -n dev-monitoring-ns port-forward svc/chunk-cache-memcached 11211
Connect:
$ telnet 127.0.0.1 11211
And check the keys:
stats slabs
STAT 10:chunk_size 752
STAT 10:chunks_per_page 1394
STAT 10:total_pages 2
STAT 10:total_chunks 2788
STAT 10:used_chunks 1573
…
So the data from Loki is going.
Well, let’s see if caching gave any results.
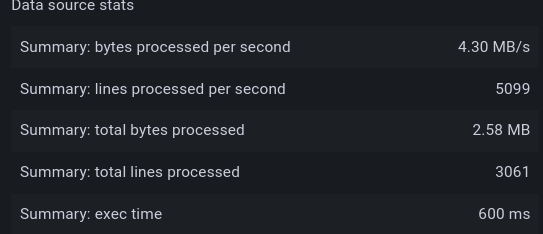
Before enabling caching — 600 milliseconds :
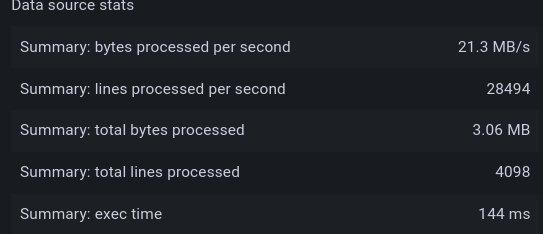
After enabling caching — 144 milliseconds :
Index cache
Add another instance of Memcached:
$ helm -n dev-monitoring-ns upgrade --install index-cache bitnami/memcached
Update the values (I don’t know why there is query\_range and chunk\_cache, but no something like index\_cache):
...
    storage_config:
      ...
      boltdb_shipper:
        active_index_directory: /var/loki/botldb-index
        shared_store: s3
        cache_location: /var/loki/boltdb-cache
      index_queries_cache_config:
        memcached:
            batch_size: 256
            parallelism: 10
        memcached_client:
            host: index-cache-memcached.dev-monitoring-ns.svc
            service: memcache
...
Deploy, and check the config in the Pod again:
$ kk -n dev-monitoring-ns exec -ti loki-read-5c4cf65b5b-gl64t -- cat /etc/loki/config/config.yaml
…
storage_config:
…
index_queries_cache_config:
memcached:
batch_size: 256
parallelism: 10
memcached_client:
host: index-cache-memcached.dev-monitoring-ns.svc
service: memcache
…
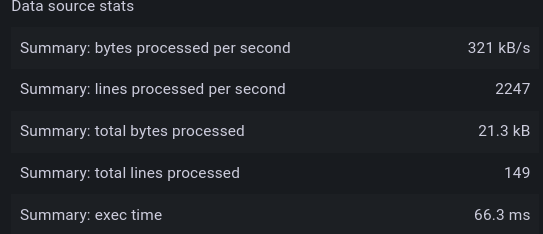
And the result of executing the same request is now 66 ms :
Query Frontend, and parallel queries
Documentation — Query Frontend.
Query Frontend works as a load balancer for Queriers, and breaks requests over a long period of time into smaller parts, then gives them to Queriers for parallel execution, and after the request is executed, collects the results back into one response.
For this purpose, in the limits\_config set split\_queries\_by\_interval, the default is 30 minutes.
The parameters of parallelism are set through the querier max\_concurrent – the number of simultaneous threads for executing requests. I guess, this can be set x2 from the CPU cores.
In addition, in the limits\_config we can have a limit on the total number of simultaneous executions in the max\_query\_parallelism parameter, in which the number of Queriers (the Read Pods) must be multiplied by max_concurrent. Although I'm not sure yet how to configure it if autoscaling is enabled for the Read Pods.
Our monitoring running on the AWS EC2 t3.medium instances with 4 vCPUs, so let's set max\_concurrent == 8:
...
    querier:
      max_concurrent: 8

    limits_config:
      max_query_parallelism: 8
      split_queries_by_interval: 15m
...
Slow queries logging
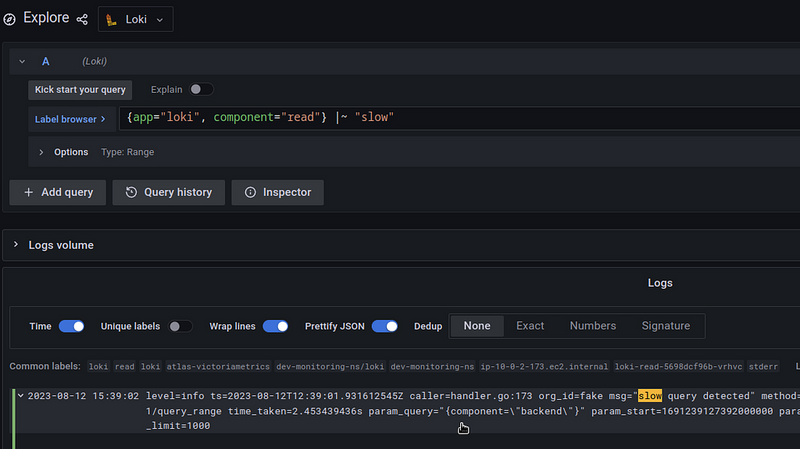
To debug slow requests, you can set the log\_queries\_longer\_than parameter (default 0 – disabled):
...
    frontend:
      log_queries_longer_than: 1s
...
Then in the Reader’s logs, you’ll get records with the param_query with the slow query:
The optimization results
In general, this is all that I found for optimization, and the result is really nice.
If a test request before all the settings described above was executed for 5.35 seconds :
Then after 98 milliseconds :
Timeouts, and 502/504 errors
Also, it is worth saying about the timeouts for the execution of requests.
Although after all the performance settings I do not see 502/504, but if they appear, you can try to increase the timeout limits:
...
    server:
      # Read timeout for HTTP server
      http_server_read_timeout: 3m
      # Write timeout for HTTP server
      http_server_write_timeout: 3m
...
Useful links
- Getting Started with Grafana Loki, Part 1: The Concepts
- Getting Started with Grafana Loki, Part 2: Up and Running
- Grafana Loki Configuration Nuances
- Use Loki with KubeDB
Originally published at RTFM: Linux, DevOps, and system administration.



Top comments (1)
Using Recording Rules in Grafana Loki can speed up queries by storing common results ahead of time. Caching helps to avoid repeating the same work, making things faster. Running queries in parallel also improves performance by handling multiple tasks at once.