Introduction
The use of Kubernetes has grown largely over a few years. But managing Kubernetes on a large Org level is never easy. Apart from security and configuration management, another crucial aspect of management is Cost. This can be a tedious task to monitor all running resources and identify the cost leaks or figure out the ways to optimize the cost consumption.
In such a scenario, Kubecost comes into play. Kubecost provides real-time cost visibility and insights by inspecting the cost allocation using Kubernetes concepts and providing unified cost monitoring and optimization suggestions.
In this tutorial, we will be creating a cluster on Digital Ocean and then deploying Kubecost on top of it to find the cost insights for the cluster.
Adding a cluster on Digital Ocean
Digital Ocean is a cloud hosting provider that offers cloud computing solutions and IaaS on the core principles of high scalability, reliability, and affordable pay-as-you-use pricing models. Now let's go ahead and create a cluster with the below-mentioned steps.
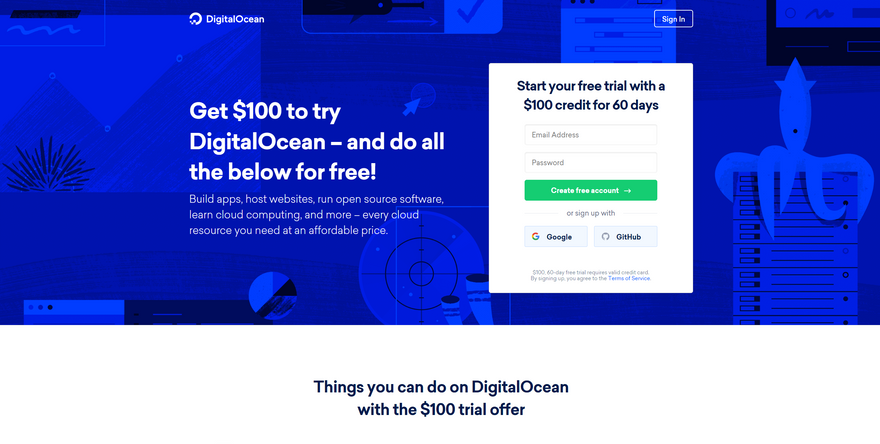
Step 1: Sign up for a Digital Ocean account if you don't have one yet or else use your existing credentials to log in. They provide 100$ credits for 60 days when you sign up.
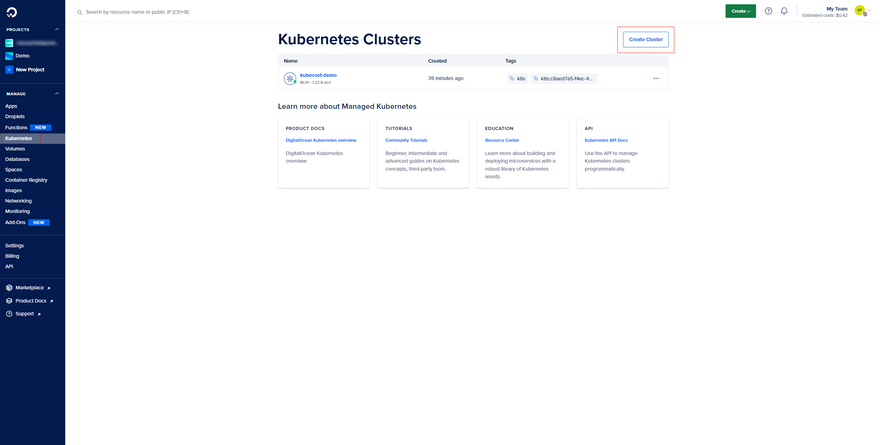
Step 2: Once you're signed in, click on Kubernetes from the left navigation panel and then hit the Create Cluster button to choose the cluster configuration.
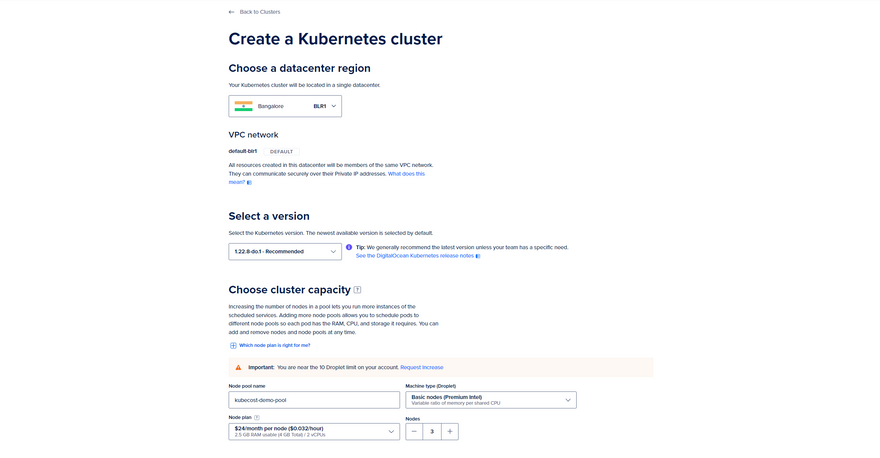
Step 3: In the Create a Kubernetes cluster window, you can choose the config you want for your cluster. But for the sake of this tutorial, you can use the config mentioned below to create the cluster.
Choose a datacenter region - Choose the one closest to you (BLR1 for me)
VPC network - This will be already set at Default
Select a version - Use the Recommended one (1.22.8-do.1 for now)
Choose Cluster Capacity - Select as mentioned below.
-> Node Pool Name - Give a name as you want
-> Node Plan - $24/month per node
-> Machine Type - Basic Nodes (Premium Intel)
-> Nodes - 3
Add extra reliability to critical workloads - Leave it at default
Finalize - Select as mentioned below
-> Name - Assign a name to you cluster
-> Project - Leave it at default
-> Tags - Leave it for now
Now click on Create Cluster button and wait for the cluster to get provisioned.
Step 4: Once the cluster is provisioned and is in a running state, we will have 2 ways to connect to the cluster from our local machine. We can either choose the automated way by using the [doctl](https://docs.digitalocean.com/reference/doctl/how-to/install/) or we can opt to use the manual way by downloading the config file for the cluster.
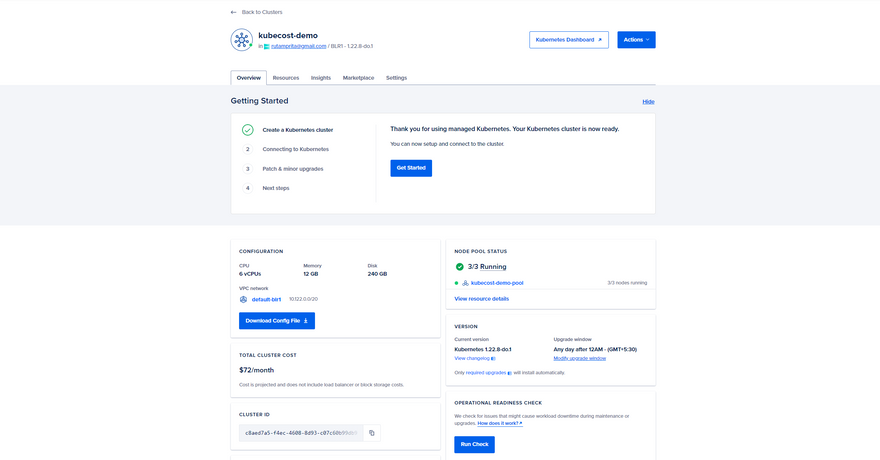
We will use the manual way, for now, to connect to our cluster. So, let's download the cluster config file.
Step 5: Once you have the config file downloaded, either use the config file explicitly with the command below to fetch the cluster nodes.
kubectl --kubeconfig=~/<pathtodirectory>/kubecost-demo-kubeconfig.yaml" get nodes
Or you can simply overwrite the config file in the .kube folder in your system to access the nodes normally using kubectl without specifying anything extra. This should return you the list of nodes in your cluster.
kubectl get nodes
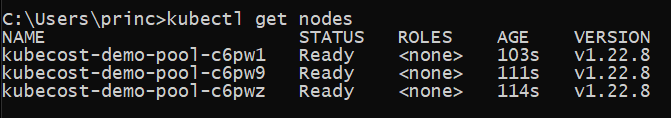
This confirms that we are now ready to work with our cluster from the terminal.
Note: If you don't have
kubectlinstalled already, please follow this guide to get it done.
Deploying Kubecost in the Cluster
We have to now deploy Kubecost in our cluster to see it in action. So, let's get started with the following steps.
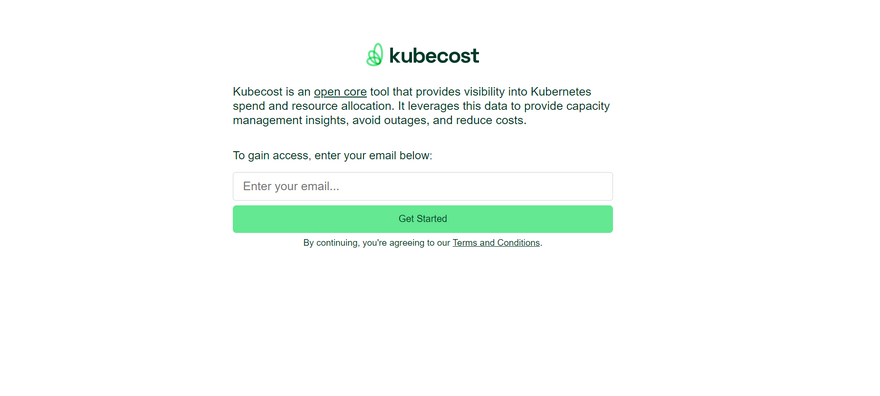
Step 1: Navigate to the Kubecost install page and provide your email and click Get Started. This will take you to the instructions page and a unique kubecostToken will be generated for you.
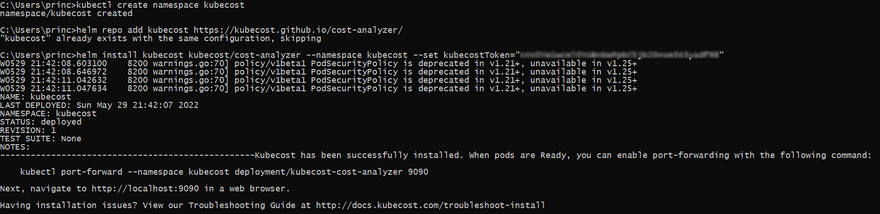
Step 2: Now we will create a namespace for Kubecost and then run the commands below to install Prometheus, Grafana, and kube-state-metrics, along with Kubecost.
kubectl create namespace kubecost
helm repo add kubecost https://kubecost.github.io/cost-analyzer/
helm install kubecost kubecost/cost-analyzer --namespace kubecost --set kubecostToken="YourKubecostTokenHere"
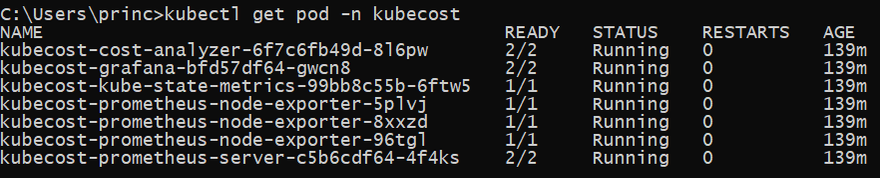
Step 3: We have to now check the pods in the kubecost namespace and wait till all of them are in a running state.
kubectl get pod -n kubecost
Step 4: Once we have all the pods running, we simply need to enable the port forwarding to be able to interact with the Kubecost GUI hosted on localhost:9090.
kubectl port-forward --namespace kubecost deployment/kubecost-cost-analyzer 9090
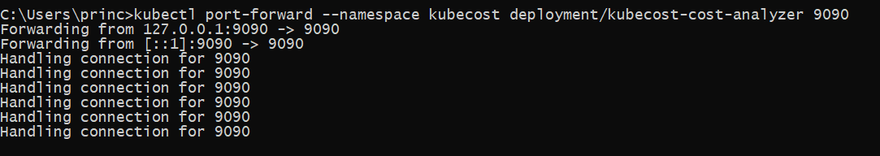
Now, we are ready to explore the Kubecost UI and gain insights into our cost utilization.
Kubecost GUI
Kubecost GUI is generally hosted at localhost:9090. You can also expose the port 9090 as a secure endpoint on your cluster to remove the need to port forward.
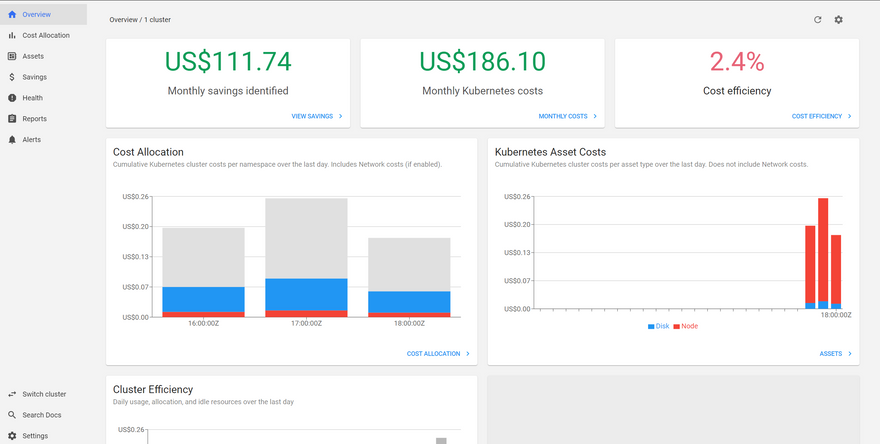
We can now explore different aspects of the cost consumption as mentioned below.
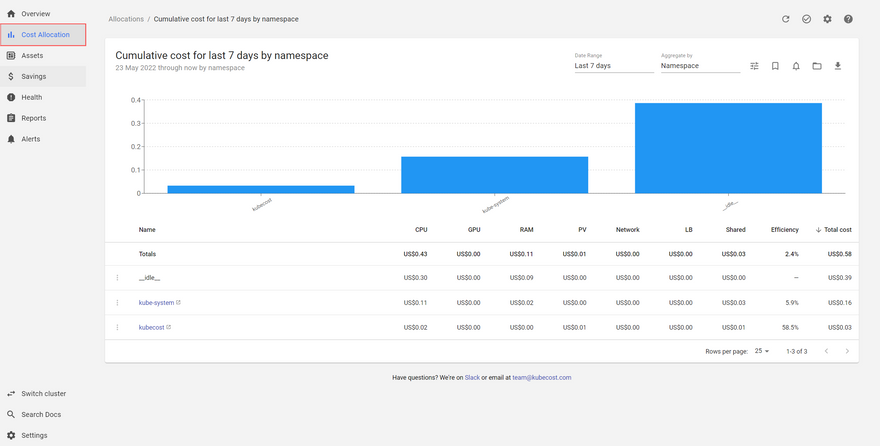
Cost Allocation
This section shows the cumulative cost allocation/utilization for the last 7 days for each namespace in the cluster. The table provides a clearer picture of what configuration of resources are being consumed by that namespace and how much cost it incurs.
You can simply visit this page by clicking on Cost Allocation from the left navigation pane or by clicking on the same Cost Allocation button under the cost allocation graph on the Overview page itself.
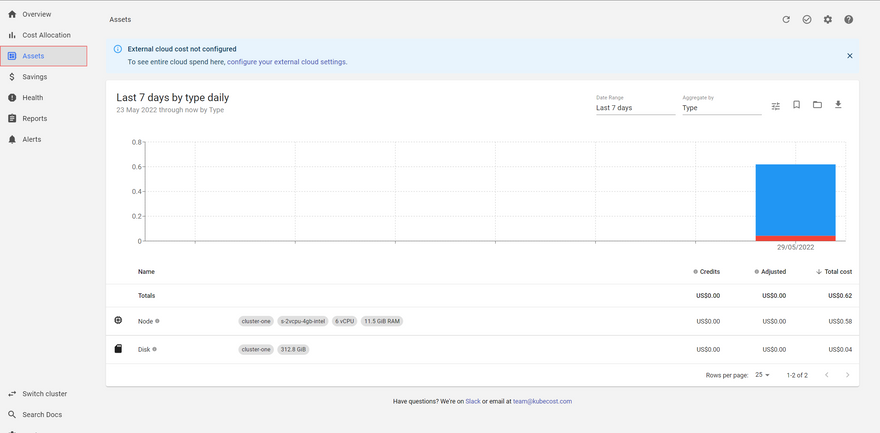
Assets
This section lists out the assets utilized and the total cost incurred in the last 7 days filtered by daily.
You can visit this page in a similar way from the left navigation pane or from the Assets graph on the Overview page.
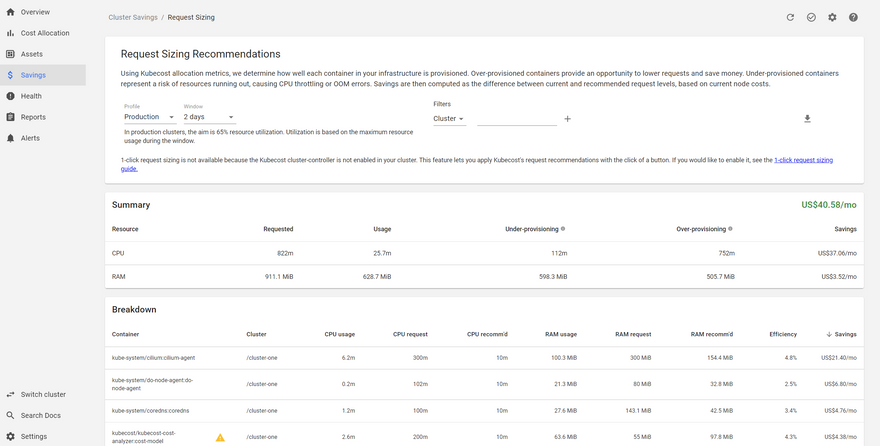
Savings
This is gonna be the favorite part for any ORG as it lists out the different cost-saving optimization techniques that could save them a huge amount of money in the monthly bill.
Navigating to this page is really easy and you can do that from the same navigation pane or by clicking on the View Savings on the Overview page.
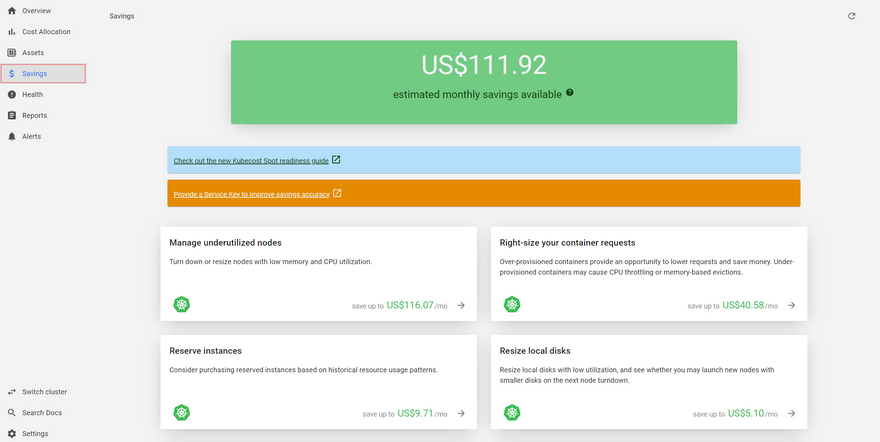
Once you're on this page, you can click on each of these suggestions to find out more detailed information on how to achieve those.
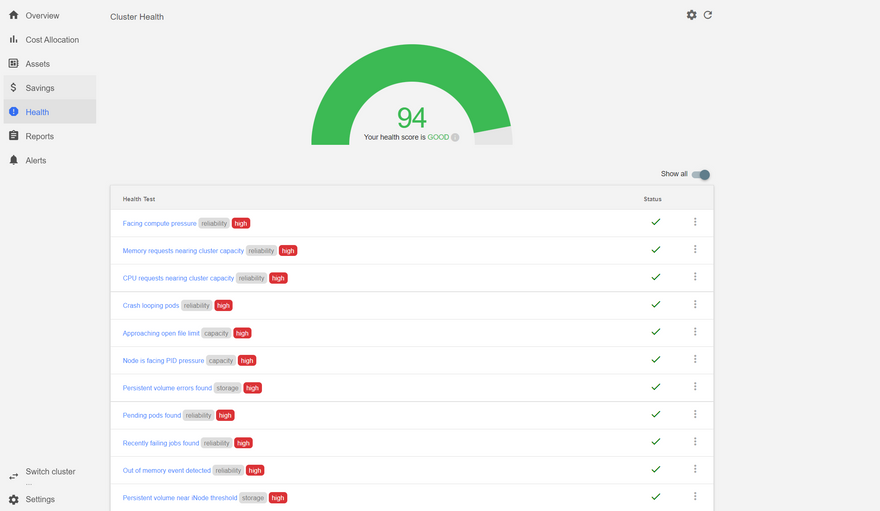
Health
In addition to all those things related to cost, Kubecost also has its in-built metrics to determine the overall cluster health score based on infrastructure reliability and performance risks.
You can simply click on Health from the left navigation pane and scroll through the list of all accessed parameters for the health test.
Clicking on each of these parameters will open up a pop-up with more information about them.
Kubecost also allows you to set up customized reports and alerts as per requirement based on specific filters. For all the cost-related information that we saw above, we also have the option to download those reports in CSV formats.
Conclusion
We have now reached the end of this tutorial where we successfully created a cluster using Digital Ocean managed K8s and then deployed Kubecost in it to find out on-the-go cost-utility insights for the cluster.
We are now clear on how to configure Kubecost and how to use its GUI to gain all the information relating to Cost in our cluster. Apart from all the features, one mentionable thing is that Kubecost provides all these features even in their free plan. But, you can also have the option to upgrade to a paid Business or Enterprise version as well.
Lastly, feel free to drop in your feedback and show some love to the article if you really liked it.
Note: All the dashboard images used in this article are sole properties of Digital Ocean and Kubecost respectively and are used here only for illustrative purposes.


Latest comments (0)