This is an excerpt from Chapter 2 of The Definitive Guide to Measuring Web Performance.
Now that you know why your website needs to be fast, you need to know how to go about measuring it.
This chapter will show you the common metrics used to measure website performance and what they are measuring.
Page Load Time
In the beginning, there was PageLoad. Website performance was measured with a single measurement of the time until the PageLoad event is fired.
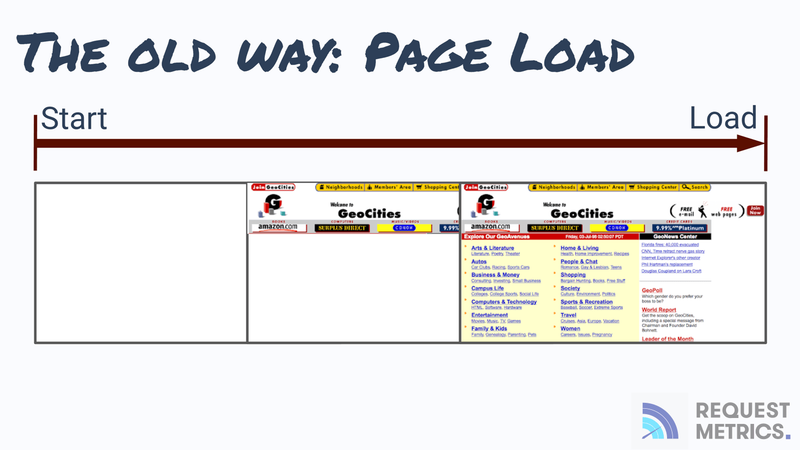
But PageLoad doesn't fully describe performance. Some sites initially load really fast, but dynamic content needs to load. PageLoad doesn't fully capture whether a website feels fast.
Worse, PageLoad was easy to manipulate. Developers could improve their PageLoad time by deferring work with JavaScript. Lazy-loading, async script loaders, client-side rendering, and dynamic content were all patterns that often improved PageLoad time, but created a slower experience from the end user perspective.
What do we do instead?
There are lots of ways a website can feel slow: slow to start, slow to finish, jumping around, slow to respond, and more. We can't use one metric to understand performance anymore.
The Core Web Vitals
In 2019, Google introduced a set of metrics intent on measuring the actual performance of a website as the users would see it. These metrics are collectively called the Core Web Vitals.
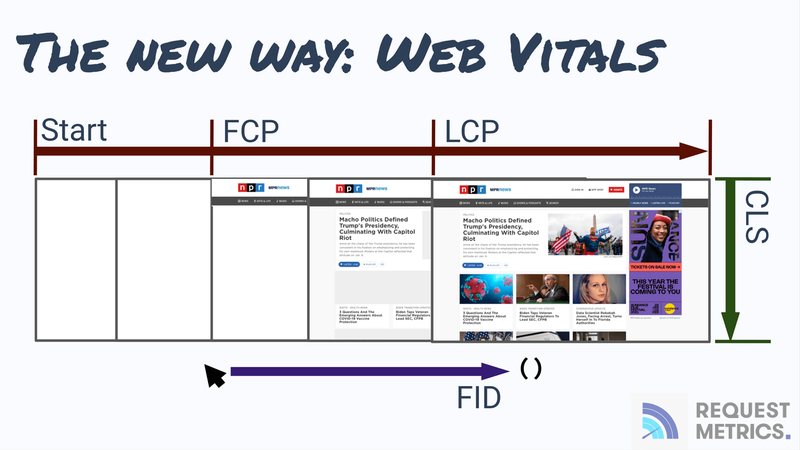
They are measured in all Chrome-based browsers, including the Googlebot spider, which uses these scores to influence page rank.
Note that only Chrome-based browsers support these metrics for now. Core Web Vital metrics measure the performance for Chrome desktop and Android mobile users, but not iOS devices, Safari users, or Firefox.
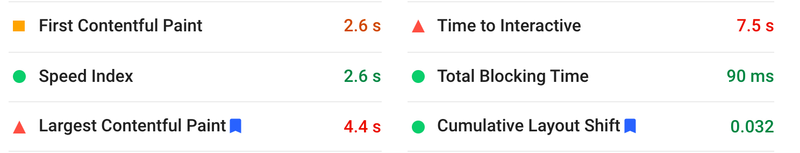
First Contentful Paint (FCP)
"First Contentful Paint" measures how long it takes to show the user that the request has been received and the page will load. For example, when you click on a news story, FCP measures the time from the click until the NPR News header renders.
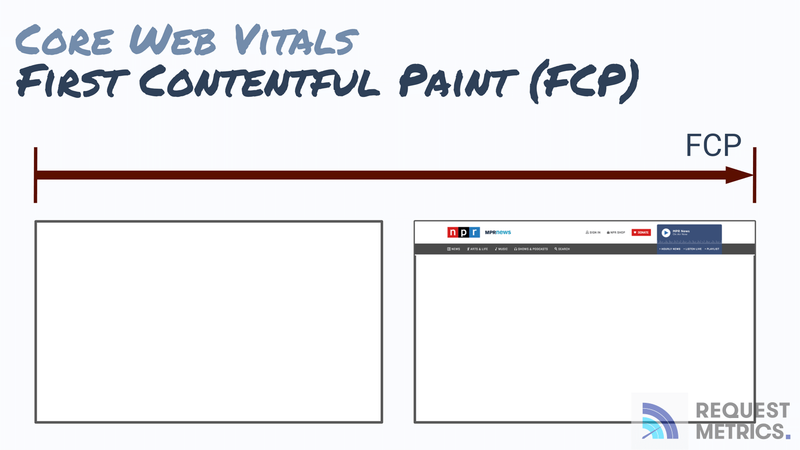
FCP encourages websites to respond quickly to requests. Learn more about First Contentful Paint and how to measure it.
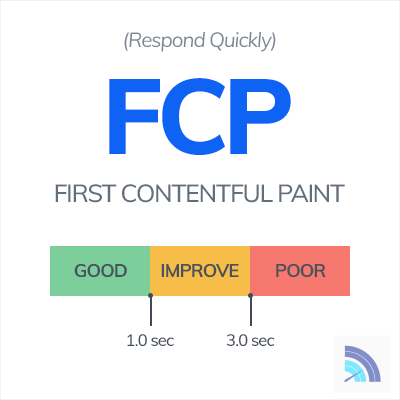
Google recommends that your FCP should be less than 1.0 second. Scores of greater than 3.0 seconds are notably poor and are likely to have a problem.
Largest Contentful Paint (LCP)
"Largest Contentful Paint" measures how long it takes until the browser renders the largest amount of content to the screen. At this point, ideally, the user can see the content they are looking for and believes the page is nearly done.
It would be more accurate if you measured the time until the most important content was visible, but that's difficult to do programmatically. LCP is a proxy measurement for most important content.
An example, navigating to the homepage of NPR News has a few different renders, but this is the largest one by pixel area:
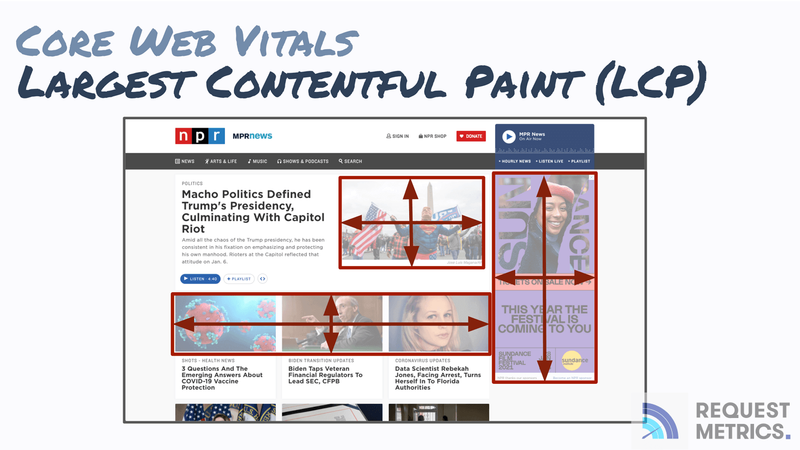
The advertisement is probably not what the user is looking for, but the article images might be.
LCP encourages websites to finish quickly by emphasizing their primary content and making sure it loads fast. Learn more about Largest Contentful Paint and how to measure it.

Google recommends that your LCP should be less than 2.5 seconds. Scores of greater than 4.0 seconds are notably poor and are likely to have a problem.
Cumulative Layout Shift (CLS)
"Cumulative Layout Shift" is a little harder to understand because it does not measure time. CLS measures how much the content on a page moves around as other content is loaded and rendered. Like this:

Layout Shifts measure how late-rendered content affects the user experience of a page. Layout shifts that push important content around are really frustrating to use.
CLS discourages websites from moving content around once the user sees it and minimizing the amount of late-rendered content. Learn more about Cumulative Layout Shift and how to measure it.

Your CLS score should be less than 0.1 and no worse than 0.25.
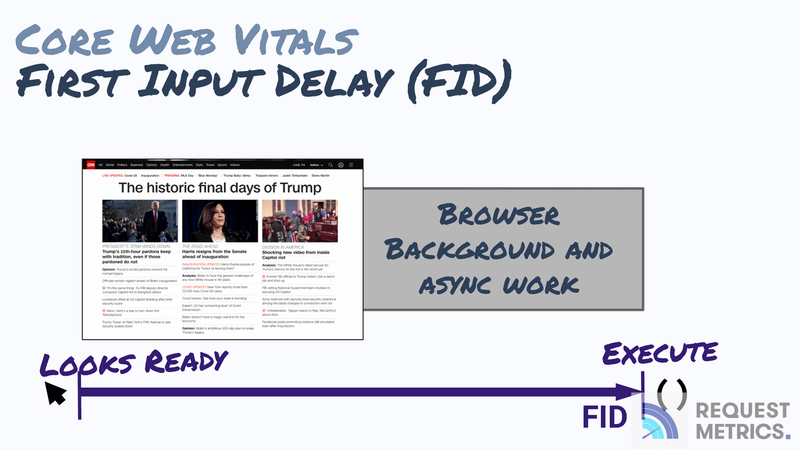
First Input Delay (FID)
"First Input Delay" measures whether the page is really done when the user thinks it's done. If the browser is busy downloading, parsing, and running JavaScript when the user clicks on the page, there will be a delay until the browser can handle the event and trigger the click event. FID measures this delay.
FID discourages websites from loading too much JavaScript before the user begins interacting with the page. Learn more about First Input Delay and how to measure it.
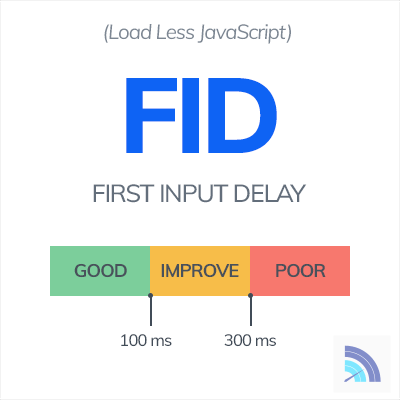
Interaction delays are easily noticeable by most people, so you shouldn't tolerate much delay here. Less than 100 ms ideally, and definitely no worse than 300 ms.
Other Common Performance Metrics
Aside from the Core Web Vitals, there are several other metrics that are commonly used by popular performance tools.
Time to First Byte (TTFB)
Time to First Byte measures the time until your server returns it's first byte of data. This represents both the network latency of your users as well as the processing time your server requires to assemble the document.
TTFB is a subset of the First Contentful Paint metric, which is also measuring the document size, parse, and render time.
Time to Interactive (TTI)
Time to Interactive is a measurement from Chrome Lighthouse that measures the time required until a page is fully interactive, including painted, JavaScript completed, and the browser is done with its background tasks.
TTI includes both the Largest Contentful Paint, the First Input Delay, as well as other background processing timers.
Google recommends a TTI of less than 3.8 seconds to be considered fast. Sites slower than 7.3 seconds have serious performance concerns. Note that this is a wider range than LCP.
Total Blocking Time (TBT)
Total Blocking Time is the time where user input is delayed due to browser background tasks, such as JavaScript processing or parsing CSS. It measures how busy the browser needs to be in order to load your webpage.
Speed Index
Speed Index is a popular metric used by WebPageTest and Google performance tools that measures the visible changes while a webpage is loading to determine when the user believes that the webpage is done loading.
Now that you know the web performance metrics, what they measure, and what a good scores are, you need to understand the ways to gather these metrics. We'll cover that in the next chapter. Read on!

Top comments (0)