With the maturing of DevOps culture and the prevalence of cloud services, the microservice architecture system has become the de facto standard for developing modern-day large-scale applications. While scaling and managing distributed systems are easy, increasing service interactions create new problems.
At the dawn of these changes, teams responsible for delivering microservices-based applications are monitoring their performance in extremely different ways in comparison to the traditional monitoring strategies that have resulted in unnecessary data silos.
Traditional monitoring solutions won’t work anymore. DevOps teams, therefore, need a centralized solution that offers a complete view of their systems. And this is what an observability-based monitoring system can do.
But before moving ahead to the observability for monitoring, let’s briefly take a glance at what leads to the need for such changes in application monitoring.
The Unpredictability of Microservices
A decoupled system consists of multiple components that are located on different networked computers that coordinate and communicate with each other by passing messages. The integration and distributed nature of the system often lead to distinct ownership layers that are often challenging.
Microservices can also have issues like data inconsistency, network failure, operation overhead, complex testing, tracing failure, and much more. However, the implementation of observability across the microservices’ development environment can help a developer to understand the failure in the system, and trace errors to their root cause.
The Need To Speed Up & Maintain Software Code Development and Deployment
DevOps is all about faster development and delivery of the application with regular updates and continuous development, leading to a shorter development lifecycle with high-quality results. And if the development team cannot identify and address errors and problems before they occur, or act swiftly to make changes, it can be difficult to increase the time to market.
Besides, after designing, developing, and releasing the microservice-based application, it becomes essential to maintain it. So the developers need to continuously adjust the application as per the demands of the customer and make sure that the application works at its best.
That’s where observability comes in. By leveraging a strong observability software development teams will not only be able to increase the speed and efficiency of deployment, updates, and tracking changes but it also allows them to easily examine errors, debug code that might create bugs, customize apps according to the users’ requirements and eventually improve the performance of the application.
What is Observability?
Observability is a concept from dependability engineering directed to the concept that you don’t know about so you build a system that will enable you as a developer to debug the errors and bugs the first time it has been encountered.
Put simply, it is a technical solution that allows developers to continuously debug their application system. Observability is based on examining patterns and properties that aren’t defined in advance.
Observability uses tooling to give developers insights that can help in monitoring. In other words, monitoring can only be done after the system has some level of observability.
An observability system allows you to understand and easily trace the root cause of any errors - even in a complex application architecture like microservices. It helps in getting answers to the questions like:
- Which services handled the request?
- Where were the bottlenecks in application performance?
- What were the differences between the execution of the request and the expected behavior of the application?
- What caused the failure of the request?
- How was the request processed by each microservice involved?
Why Observability is Important?
It doesn’t make sense to push changes in the production environment without understanding whether it is making the application process better or worse. Hence, to run the Continuous Integration and Continuous Delivery (CI/CD) process as expected, there must be some kind of feedback. The “Monitor” part in the DevOps lifecycle provides the required feedback that leads to reiterating in the future.
With an observability system, you can get better control over the complex application system. As it:
- Provides insight into how the product works internally so that improvements can be made to ensure seamless performance for end-users.
- Monitors the applications’ performance.
- Easily recognize root causes of problems and aids troubleshooting
- Provide an intuitive dashboard displaying real-time occurrences.
- Has an integrated self-healing infrastructure.
- Provides freely available information.
Four Pillars of Observability
Observability can be divided into four core pillars, including logging, tracing, alerting, and monitoring
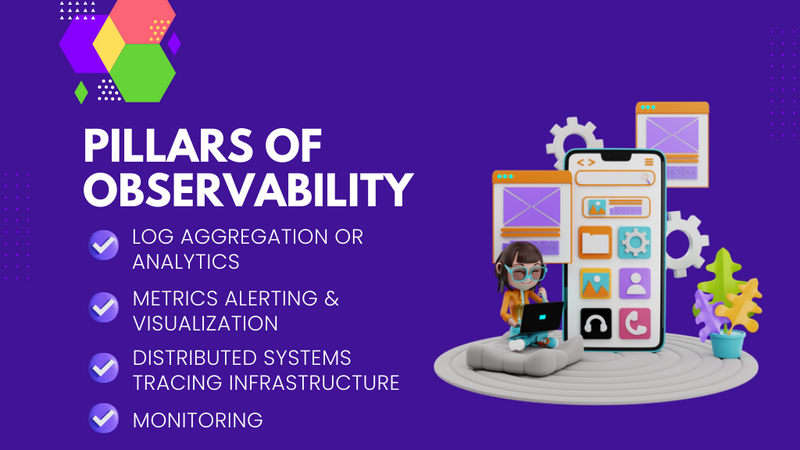
Log aggregation/analytics
Logs are immutable, time-stamped records of different events that identify and provide insights on unpredictable behavior in the application system - including what happened in the system when things went wrong.
Logs are available in three formats, i.e., plain text, binary and structured. It uses one of the six generic protocols namely HTTP, Syslog, Kafka, SFTP, OpenStack, and Log Shuffle that instruct services to send logs to the specified destination, if you want to operate your log receiver. However, ingesting logs in a structured way (like JSON format) is much recommended as it offers additional data and metadata that make logs easy to query.
Alerting/visualization
Metrics, numerical representations of data, can be used to determine the overall behavior of a component or service over time. There are named attributes, labels, values, and timestamps to express information about Service-Level Agreements (SLAs), Service-Level Objectives (SLOs), and Service-Level Indicators (SLIs). Unlike logs, metrics are by default structured to make it easier to optimize and query storage so that they can be retained for the long term.
Metrics are measured using values derived from the performance of the system rather than from record-specific events. Metrics can be correlated across the component infrastructure and get an aggregated view of system performance and health, making it a real-time saver for developers.
Metrics can also be used to gather information like system uptime, the number of requests received per second, response time, and the processing power or memory being used by the application. Usually, Site Reliability Engineering (SRE) and DevOps engineers use metrics to trigger alerts when the system value exceeds the specified threshold.
Distributed systems tracing infrastructure
For any given transaction, a trace shows the operation as it moves from one node to another in a distributed system infrastructure. The host system encodes every operation (i.e. span) performed by the microservice that operates as it moves through its system. Traces can track the course of one or more spans in a distributed system and detect the cause of the breakdown or bottleneck.
In tracing, each event has global ID metadata incorporated into each step in the request flow; a distributed tracing system like Zipkin is used to inspect and visualize traces.
Monitoring
Monitoring is a crucial component that refers to the application and infrastructure controls and supports analyzing long-term trends to build the dashboard and alerting. It allows development teams to watch and understand the system’s state based on predefined sets of metrics and logs. In case of bottlenecks or errors, the development team gets notified before the user even knows about the existence of the problem.
Monitoring for Symptom-Based Alerting
The monitoring system needs to address the problem and its cause. Together, the observability and monitoring solutions are designed to:
Give major indicators of service degradation or outrage.
- Identify service degradations, unauthorized activities, bugs, and outrages.
- Troubleshooting.
- Plan capacity and business purposes by detecting long-term trends.
- Uncover unwanted side effects an added functionality and change can create.
But first, we will learn what monitoring systems can do, and then we will learn how implementing observation will help in overcoming the cons of monitoring.
Blackbox Monitoring: Here, the microservice system is examined from the outside. This technique is great to get answers like what is broken and alert about the issues that have already occurred and impact the end-users.
Whitebox Monitoring: On the other hand, Whitebox monitoring is known for the system’s hard failure modes. It gives information about applications’ internal states so that we can anticipate in advance and know what can cause the problem.
To develop monitoring systems you should have an understanding of failure in the crucial components of the system beforehand. And that’s something difficult to do if your system is a complex one like microservices.
The sources of potential problems and complexity are endless if we try to collect everything from a ton of metrics. So, designing a monitoring system that is simple, reliable, and predictable is important. Moreover, the data for monitoring should be actionable to send an alert in case of failure indicating its effect and impact on any fix that has been deployed.
However, combining observability with monitoring can create a remarkable solution as it will make the solution more accurate by providing details such as single-process debugging, detailed system profiling, log collection, load testing, analysis, and inspection of traffic.
Implementation of Observability
To achieve observability, proper system or app tooling to collect accurate telemetry data is important. You can create an observable system by developing tools using open source or commercial observability software. When it comes to observability implementation, four components usually play a role:
Data Correlation: Data is processed and correlated from across your system, enabling automated or custom data curation for time series visualization.
Instrumentation: These tools collect and analyze telemetry data from the containers, applications, hosts, and other components of your system, providing visibility into your whole infrastructure.
Incident Response: Automation technologies enable information about outages to be sent to the best people and teams in accordance with their on-call schedules and technical expertise.
AIOps: By aggregating, correlating, and prioritizing incident data using machine learning algorithms, you can remove alert noise, detect issues that could impact the system, and increase response time when they do.
The Bottom Line
Observability must become part of the culture of engineers and managers as the adoption of microservices and containers increases. By doing so, your teams will be able to maximize their cloud investment. Your continuous innovation culture will drive your ability to deliver high-end software to your customers.
You don't have to be an expert in DevOps to benefit from observability. Developing a culture that is observability-centric requires an understanding of the pillars of observability. We hope this blog was helpful to you.
SOURCE: Decipher Zone


Top comments (2)
Thank you for this article, we are working on an Observability tool for my OP source project and putting a lot of effort into it. even though we understand that not everyone right now is understanding the value it can bring with it!
It's my pleasure @avital_trifsik :)
I hope the article was helpful for your project.