Problem
I'm working for the enterprise organization and assigned the task of improving the monitoring system. Since the monitoring system is a centralized system used for the whole organization, we have to make it easy to use for cross teams in the organization. The system uses Grafana for visualization parts. I will not mention the backend of Grafana in this post. If you're interested, you can refer to my post Ultra Monitoring with Victoria Metrics
In the past, Grafana data sources were manually added via WebUI. We want to avoid doing such kinds of operations. Instead, it should be automated as much as we can. Also, we need to follow GitOps practice to manage, and track/audit changes.
Solution
Thanks to Grafana Provisioning feature. It’s possible to manage data sources in Grafana by adding one or more YAML config files in the provisioning/datasources directory. Each config file can contain a list of data sources that will get added or updated during start up. If the data source already exists, then Grafana updates it to match the configuration file.
Combine with reload provisioning configurations API, we can achieve the goal without needing to restart Grafana on every data sources change
The idea is that Grafana data source configuration files will be kept in a Git repository. Then using AWS Automation to sync configurations to Grafana servers. The Git repository structure looks like below:
.
├── team-1
│   ├── clickhouse-2.yaml
│   └── cloudwatch-1.yaml
├── team-2
│   ├── clickhouse-1.yaml
│   └── influxdb-1.yaml
├── team-3
│   ├── elasticsearch-1.yaml
│   └── victoria-metrics-1.yaml
└── team-4
    ├── mysql-1.yaml
    └── prometheus-1.yml
The solution is a combination of AWS Automation Runbook and Secret Manager so it’s a secured, AWS fully-managed, serverless solution.
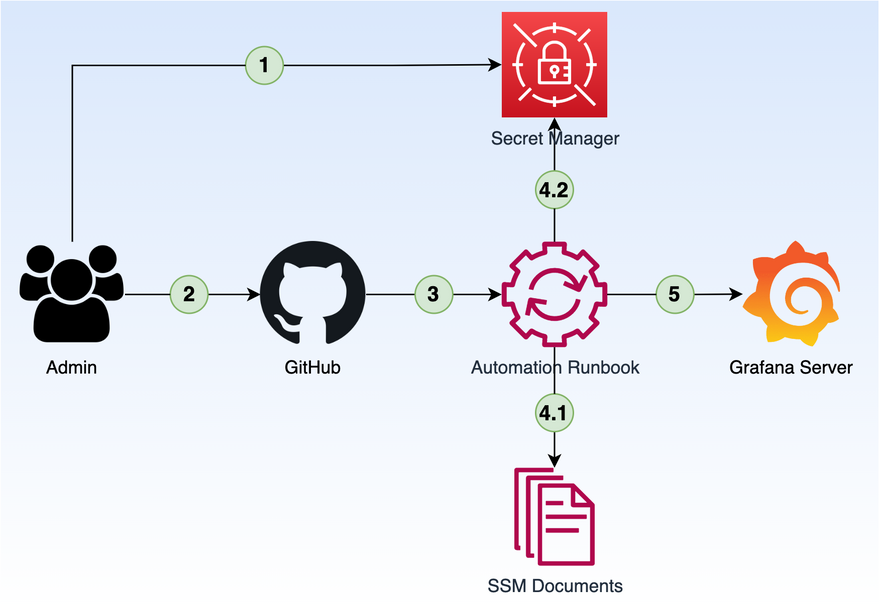
The following diagram is high-level architecture of the solution:
But wait!! Why is Secret Manager in architecture diagram?
To answer this question, let's see a data source is stored in the repository:
name: Prometheus Example 1
type: prometheus
access: proxy
url: http://123.123.1.1:9090
user: "username"
password: "password"
basicAuth: "false"
jsonData:
  httpMethod: POST
Data sources may need credentials info, and we cannot leave them as plaintext in the repository which leads to security issues.
Let's back to architecture diagram. Here is how the process works:
- Administrators create a secret to store credential of a data source (can be automate portal and/or chatbot)
- Administrators review and merge a PR
- When PR merged, GitHub/Gitlab pipeline triggers predefined Automation runbook
- Runbook executes steps from SSM Documents and gets secrets from Secret Manager
- Runbook executes defined steps to generate data source provisioning file and invoke Grafana API to reload data sources.
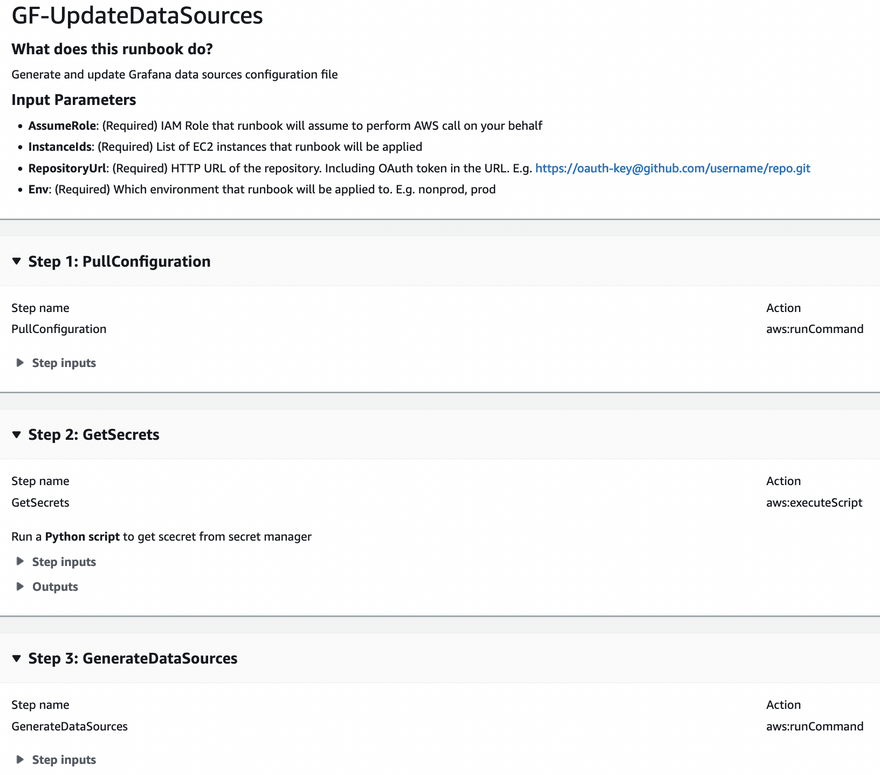
Runbook has three main steps:
- Pull the repository from GitHub/Gitlab into Grafana server
- Get data source credentials from Secret Manager
- Generate data source provisioning files with credentials
Secrets stored in Secret Manager will have name as following format:
{env}/grafana/datasource/{team}/{datasource-name}
Eg. prod/grafana/datasource/team-3/elasticsearch-1
Secret value are store as JSON format. E.g:
{
  "username": "elasticUser",
  "password": "elasticP@ssw0rD"
}
Each secret will have two required tags. They are:
env: prod/qa/dev-
secret-type: grafana-datasource.
Data source file now looks like as following:
name: Elasticsearch Example 1
type: elasticsearch
access: proxy
url: http://elasticsearc.example.com:9200
user: "@team-3/elasticsearch-1:username"
password: "@team-3/elasticsearch-1:password"
database: logs-index
basicAuth: true
jsonData:
  esVersion: 7.7.0
  includeFrozen: false
  logLevelField: ""
  logMessageField: ""
  maxConcurrentShardRequests: 5
  timeField: "@timestamp"
Step #2 in the runbook, I write a Python script to get secret values from Secret Manager and pass to step #3. The Python script return secrets as JSON format as following structure:
{
  "team-1": {
    "clickhouse-2": {
      "username": "team-1-clickhouse-2-username",
      "password": "team-1-clickhouse-2-password"
    }
  },
  "team-2": {
    "mysql-1": {
      "username": "mysql-1-username",
      "password": "mysql1P@ssword"
    }
  },
  "team-3": {
    "victoria-metrics-1": {
      "authorizationToken": "vict0ri@Metric$Tok3n"
    },
    "elasticsearch-1": {
      "username": "elasticUser",
      "password": "elasticP@ssw0rD"
    }
  }
}
Step #3 in the runbook, I also write a small Python script to combine data source files in the repository into Grafana data source provisioning file, and also replace secret holders by the secret values from Secret Manager.
Grafana data source provisioning configuration looks like:
[root@grafana datasources]# pwd
/var/lib/grafana/provisioning/datasources

[root@grafana datasources]# ll
total 16
-rw-r--r-- 1 root root 362 May 22 11:00 team-1.yaml
-rw-r--r-- 1 root root 628 May 22 11:00 team-2.yaml
-rw-r--r-- 1 root root 669 May 22 11:00 team-3.yaml
-rw-r--r-- 1 root root 515 May 22 11:00 team-4.yaml
/var/lib/grafana/provisioning/datasources/team-3.yaml
apiVersion: 1
datasources:
- access: proxy
  basicAuth: true
  database: logs-index
  jsonData:
    esVersion: 7.7.0
    includeFrozen: false
    logLevelField: ''
    logMessageField: ''
    maxConcurrentShardRequests: 5
    timeField: '@timestamp'
  name: Elasticsearch Example 1
  password: elasticP@ssw0rD
  type: elasticsearch
  url: http://elasticsearc.example.com:9200
  user: elasticUser
- access: proxy
  isDefault: true
  jsonData:
    httpHeaderName1: Authorization
  name: Victoria Metrics Example 1
  secureJsonData:
    httpHeaderValue1: Bearer vict0ri@Metric$Tok3n
  type: prometheus
  url: http://ultra-metrics.com


Top comments (2)
Jag tröttnade på de vanliga sajterna och frågade en polare i Stockholm om tips. Han skickade över Swiper och sa att det var värt att testa. Det som fångade mig direkt var hur smidigt allt flöt på mobilen här i Sweden. Jag har kört en del slots online tidigare, men här kändes vinstchanserna faktiskt rimliga. Efter en skön vinst igår är jag mer än nöjd med utbudet. Det är se-geografi när den är som bäst för oss som gillar spänning utan krångel.
Source code: github.com/ops-studio/grafana-ops