New Relic recognized as a Leader in the 2023 Gartner® Magic Quadrant™ for APM and Observability
We’re proud to share that New Relic has been recognized as a Leader in the Gartner Magic Quadrant for APM and Observability report for the 11th time. Learn why we were recognized for our ability to execute and completeness of vision in this year’s report.
Download Your Complimentary Copy
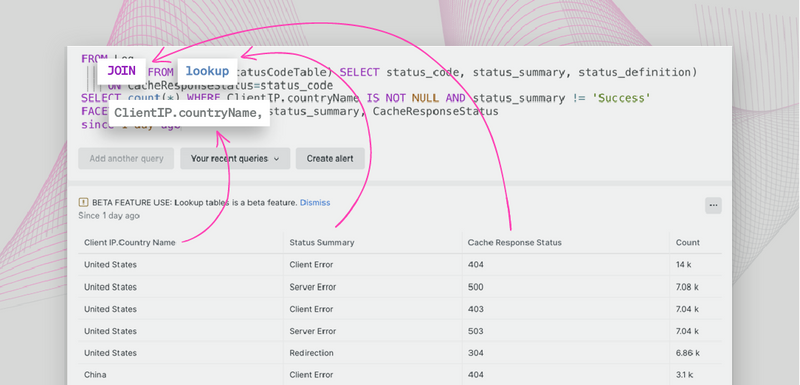
JOINs and lookups available across all data types, GeoIP available for logs
Correlate any telemetry data and any business data in one place to connect the dots between the performance of your applications and infrastructure, business operations, and customer experiences.
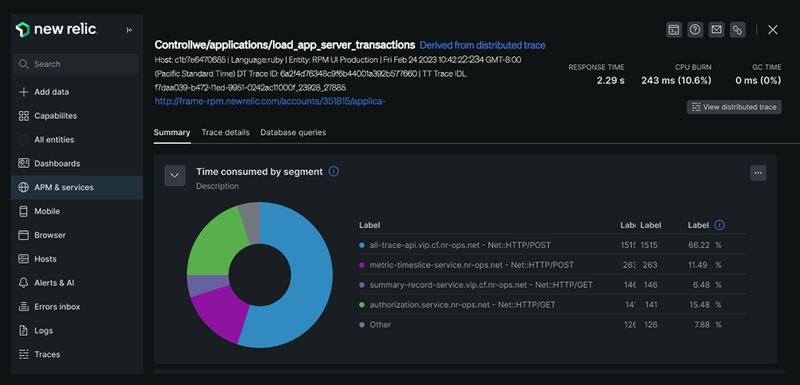
Get a focused view of app performance with distributed traces in transactions
We’ve rolled out a few enhancements allowing you to view associated distributed traces for your transaction data easily. Now you can quickly and effectively understand app performance by accessing the contextual data you need to get to root-cause analysis faster without the extra clicks.
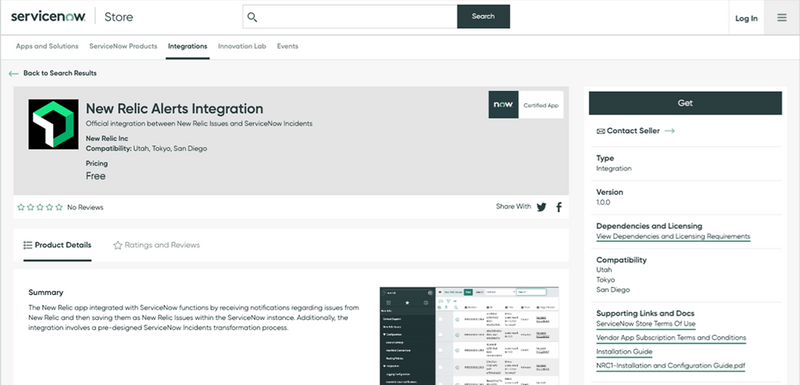
New integration between New Relic workflows and ServiceNow is now available
A new certified two-way sync-back integration between New Relic and ServiceNow is live and available as a webhook destination. Customers using the existing integration can continue using the current destination. The new integration can be accessed from the ServiceNow Store.
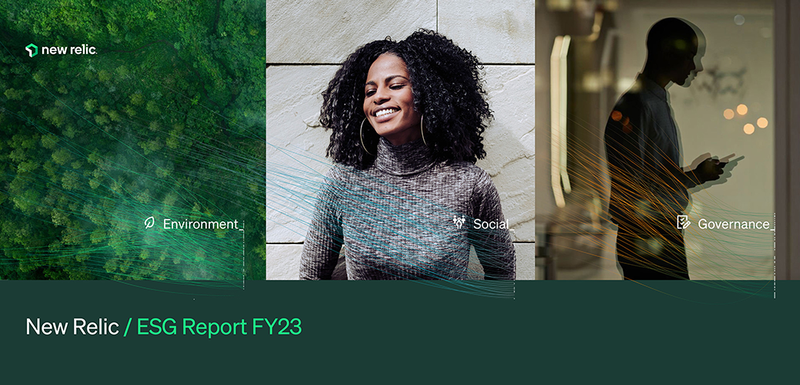
New Relic releases ESG Impact Report for fiscal year 2023
We published our second annual environmental, social, and governance (ESG) 2023 Impact Report. The report includes highlights like being the first observability company to set a goal to achieve net-zero greenhouse gas (GHG) emissions by 2030. We also donated $8.5 million in product and discounts to nonprofits, completed our transition towards becoming a Flex First company, and consolidated the management of data security issues.
Six Steps to Achieve Business Observability
Empower your enterprise with New Relic's ”Six Steps to Achieve Business Observability.” Harness real-time data, demolish silos, and deploy impactful, data-informed strategies. With New Relic, elevate your business by turning data into dollars! Learn More
How IGS cut costs while improving monitoring
Discover how IGS scaled and slashed costs with New Relic in our latest blog, ”How IGS cut costs while improving monitoring.” From integrating Kubernetes to enhancing logging and alerting, New Relic proved pivotal in driving reliability and efficiency.
New Relic User Group Meetups
Summer Series
New Relic user meetups are back and you’re invited! Join us for one of upcoming user group meetups happening across the US and Canada this summer with food, drinks, and of course—data talk! We’ve got a jam-packed agenda and we’ll wrap up with a little fun playing golf, arcade games, or ping pong (depending on your city)! Register Now
Maximizing observability with New Relic logs Thu, July 13
This workshop is a comprehensive introduction to understanding and working with logs in New Relic. Get hands-on experience with your data. Practice importing logs and then parsing, filtering, dropping, and alerting on log data in New Relic. Register Here
Understanding the “Three Strikes” behavior in synthetics
Synthetic monitors can tell you when part of your app is down or not functioning as expected. Getting notified when there is an issue is important, and we know that getting a notification for every glitch in the matrix makes too much noise to be useful. That’s why synthetic monitors come with a three strikes functionality out of the box. This explanation helps you understand how we help you find signal, not noise.
Not an existing New Relic user? Sign up for a free account to get started! 👨💻



Top comments (4)
I’ve been hunting for a reliable casino login portal and stumbled upon aqua-win-login.com/login/ where they host all the entry points to their gaming platform. The page is clean, clearly structured, and provides just what you need: fields for username, password, and security verification without unnecessary clutter. Before I risk real money, I’m going to test the demo mode, but seeing such a clean login layout gives me hope this site is more trustworthy than many of the flashy alternatives.
New Relic has been named a Leader in the 2023 Gartner Magic Quadrant! This shows that they are great at helping businesses monitor their tech. It’s a big achievement for the company!
Hi, monitoring systems can feel overwhelming because I’ve had days where constant alerts drained my focus the same way long casino losing streaks can wear you down. While taking a break from dashboards one night I stumbled on play jonny bonus and tried a few spins on Gates of Olympus, lost several rounds, then pushed a higher bet and finally landed a solid win that honestly lifted my mood. Since then I use short casino sessions as a reset when work starts feeling too noisy.
It's really impressive to see New Relic being recognized as a Leader in the Gartner Magic Quadrant again; their commitment to improving application performance and observability is making waves. If you're interested in exploring more about their offerings, check out corgi bet. With enhancements like distributed traces and the new integration with ServiceNow, they seem to be on a roll, making it easier for businesses to analyze performance and get insights. This kind of innovation not only benefits companies but also enhances customer experiences all around.