At Lob, we currently use Convox as our deployment platform, a “roll your own Platform-as-a-Service” that you can install to handle container orchestration on AWS’s ECS (Elastic Container Service). Convox is showing its age and this year we began the process of replacing Convox with HashiCorp’s Nomad, a flexible workload orchestrator to deploy and manage our containers on AWS.
As we prepared our migration to Nomad, our biggest concern was performance. We started our tests with a barebones proof-of-concept setup of our API in Nomad. We benchmarked and compared the two systems and found Nomad was running slower! This was extremely surprising as Convox (which leverages AWS Elastic Container Services) and Nomad both use Docker containers under the covers. We assumed going from older to newer technology would result in some performance gains.
Why is our performance suffering?
Due to the stripped-down Nomad cluster, we were initially not set up with Datadog’s agent to collect application traces and profiles.
Our initial performance testing revealed that every request performed poorly with a four-second delay regardless of load, which was unexpected. Even stranger, running a load test showed performance got better and would go up and down over time. Internally, we debated whether poor database performance was the cause. However, with the time-honored process of deleting code and observing the results, we found that the four-second delay occurred on save requests to our AWS S3 bucket.
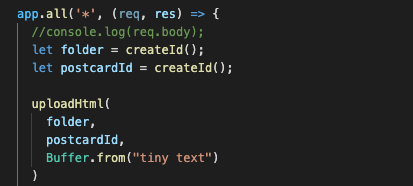
To determine if the problem was in our code or the infrastructure we needed to isolate the suspect code and configure Datadog to effectively trace interactions between our app and the infrastructure. We did this by extracting the S3 upload method from our production codebase to eliminate noise in our trace, configuring the Datadog APM trace library for this code, and enabling the Datadog agent on our Nomad cluster.
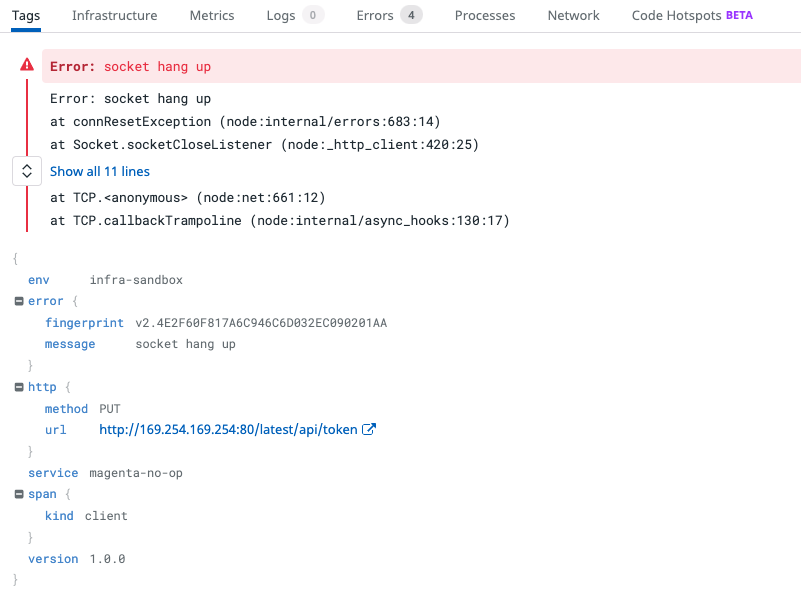
We found 4 sequential calls with exclamation marks in Datadog. Why would an S3 upload cause 4 HTTP PUT requests? And why did each request fail after exactly 1 second?
Looking closer, we found socket hang-ups and an IP address being called.
The AWS JavaScript SDK makes 4 attempts to call the Elastic Compute Cloud (EC2) metadata service (that’s the 169.254.169.254 IP address), then gives up and tries something else before successfully uploading the file to S3. This exonerated our developers as it clearly wasn’t a problem with our code. Something wasn’t right with our infrastructure.
Let’s zoom out for a minute and discuss how Amazon services share information with each other. All AWS API requests have to be signed with credentials that tie back to an IAM Role with specific permissions, like uploading objects to our AWS S3 bucket for example. Traditionally, this role would be associated with access keys and those credentials would be loaded into your application -- potentially exposing them.
AWS provides a more secure mechanism when the calls originate from an AWS service. For our existing Convox services, this was ECS Container Instance Roles. For services running on ECS with an associated instance role, the AWS SDK would automatically call the metadata API on our ECS cluster to get temporary credentials it can use to access other Amazon services like S3. This means we don’t need to include our AWS credentials in our code and the IAM permissions can be directly tied to the ECS service itself. For EC2, there exist EC2 Instance Profiles, which function almost the same.
Almost.
Why can’t, can’t, can’t, can’t, and finally can the AWS SDK reach the metadata API on my EC2 instance?
So, why are the calls to the EC2 metadata service failing, yet somehow still succeeding in the end? After hours of tearing through all the JavaScript AWS SDK documentation and finding nothing, we turned to Google. Searching for the IP address we’d seen in Datadog led to documentation on the EC2 instance metadata API:
The AWS SDKs use IMDSv2 calls by default. If the IMDSv2 call receives no response, the SDK retries the call and, if still unsuccessful, uses IMDSv1. This can result in a delay.
In a container environment, if the hop limit is 1, the IMDSv2 response does not return because going to the container is considered an additional network hop. To avoid the process of falling back to IMDSv1 and the resultant delay, in a container environment we recommend that you set the hop limit to 2. For more information, see Configure the instance metadata options.
Translation: In order for the SDK, running in a Nomad-orchestrated container, to obtain credentials it must pass through the EC2 instance to reach EC2 metadata API. This counts as two “hops” and the default hop limit is one! We changed the hop limit to two and the request time dropped from 4 seconds to 85ms.
Here is the Datadog APM trace after increasing the hop limit to two.
What’s wrong with this picture?
To put it bluntly, EC2 instance profiles are not the proper way to provide credentials to applications running in a container orchestrator. They are too coarse-grained. Permissions are granted to all applications running on the EC2 instance, not a specific application or service. After all, that’s why ECS, which runs on EC2 instances and therefore could use the EC2 instance profiles, instead relies on ECS instance profiles.
So why did we? Because we needed a temporary solution in order to trial our proof-of-concept Nomad cluster, and EC2 instance profiles were tantalizingly similar to ECS instance profiles -- our bread-and-butter solution in Convox.
Oh, and they do work. The application was able to access the private S3 bucket. Well, eventually. Mostly.
The problem is the AWS JavaScript SDK call eventually succeeds which masks the underlying issue. This violates the principle of least surprise. Basically, a system should behave in a way that most users will expect it to behave. The behavior should not astonish or surprise users. You could describe the SDK behavior as a pseudo silent failure. Our application performance was severely degraded and we were unaware anything had gone wrong. As developers, we expect things to succeed or fail, not mostly fail and then succeed.
You might be wondering why isn’t AWS setting the hop limit default higher? We don’t know for certain, but our guess would be for security purposes. A low default hop limit ensures that credential requests originate inside the EC2 instance and forces developers to make a choice to increase the hop limit and be aware of any associated risks.
Conclusion
Several lessons can be drawn from our experience tracking down this performance issue:
- Regularly test the performance of your application
- Use modern tools like Datadog when investigating performance issues
- Isolate suspect code to remove the noise and observe the signal
- Dig into the documentation
- Google can help your investigation when you uncover unique clues
We hope this article helps other developers who encounter mysterious performance problems and are looking for tips to track them down.


Top comments (0)