Adding observability to your stack helps you better understand the functioning of your complex infrastructure, minimize downtime, and enable developers to get to the bottom of issues and resolve them faster.
However, setting up observability for your infra and apps now requires even more effort, time, and money. According to a 2022 Splunk survey, over half of the organizations surveyed use eight or more observability tools.
Whether you are using a microservices-based architecture, Kubernetes, public cloud, hardware, networking, or a traditional IT stack, there are up-and-coming solutions that can fit your needs. We will get familiar with some of them in this article.
For an in-depth comparison of DataDog, Splunk, and New Relic, check out our recent comparison here.
Considerations
For startups that are choosing the right observability tools, there are different things to consider:
- Is it a low-cost solution with a generous free tier and high-value usage-based pricing?
- Is it easy to set up, learn and use?
- Does it provide customizations, scalability, and integrations with your existing tools?
- Are there any security and compliance issues?
- What kind of data do you want to retain, and for how long?
In this list, we cover today’s most popular observability tools, briefly discuss their features and pricing, and list what they are most liked for.
We have divided this into two sections: Full Stack Observability tools and other Useful Tools you should know.
Full-Stack Observability
These platforms provide end-to-end observability solutions you can leverage. These nine full-stack observability tools startups commonly use.
Grafana Cloud
Grafana, a popular open-source analytical and visualization web layer, now provides an entire observability stack through Grafana Cloud. Their in-house tools, such as Loki for logs, Prometheus for metrics, Tempo for trace, and generous free tier, make the product an excellent value for anyone getting started with observability.
Its excellent free-forever tier supports up to 3 active users and 10k series for Prometheus / Graphite metrics + 50GB logs + 50GB traces. Other features included in the free tier are 14-day data retention, Grafana OnCall, Synthetic monitoring, and alerting.
They also offer self-managed versions of their tools, a de facto standard. This is hugely beneficial because of the vast ecosystem support and availability of readymade dashboards for various tools and use cases.
Their Pro plan picks up from where the free usage ends. Its pricing is usage-based and brings additional features such as Cloud SLAs, Machine Learning, and increased retention.
Grafana’s 100+ plugins allow you to seamlessly bring in your data from many different sources, real-time and with ease. Over 2/3rds of their customers are startups and companies with less than 250 employees.
Liked for:
- Very usable free-tier with easy setup
- Intuitive and informative Grafana dashboards
- Building and delivering new features fast!
- Great for time-series graphs

https://grafana.com/products/cloud/features/
Elastic Observability
Elastic Cloud is another prevalent open-source observability tool. It is built on the trusted Elastic Stack (formerly ELK stack) to converge metrics, logs, and traces.
Elastic.co also offers security and enterprise search features along with observability.
Pricing:
Elastic has flexible pricing plans based on your usage. Paid plans start at $95/mo. Their 14-day free trial includes a deployment to explore Elastic solutions for Enterprise Search, Observability, Security, or the latest version of the Elastic Stack. Each deployment includes 8GB RAM spread out over two availability zones. They also have a free self-managed version for deploying and operating elastic products on Kubernetes.
You can also subscribe to Elastic Stack from the AWS, GCP, or Azure marketplace.
Liked for:
- Its mature ecosystem
- APM and log correlation, ability to link logs and traces
- Fast and flexible search

https://www.elastic.co/observability
Datadog
As one of the oldest and most well-rounded observability platforms out there, Datadog’s complete end-to-end offerings works for most infrastructure and app needs. Its platform offers out-of-the-box dashboards and integrations, which make it an easy recommendation. Its AI and ML tools and the ability to quickly move across the various tools make it a big hit among its users.
Datadog can get expensive quickly, one of the main reasons there is room for several other emerging players in this space.
Liked for:
- Stability and frequent feature releases
- Out-of-the-box dashboards
- Countless integrations

https://www.datadoghq.com/product/apm/
New Relic
New Relic brings 16 monitoring tools into one platform and all telemetry data - metrics, logs, and traces in one place. They also have a generous free tier that covers all of their tool offerings and is free up to 100 GB per month. Their setup is also quick and easy, with over 470 integrations available.
Liked for:
- Built on OpenTelemetry standards
- AI-based anomaly detection and alerting
- Good value for money and transparent pricing

https://newrelic.com/instant-observability/node-js
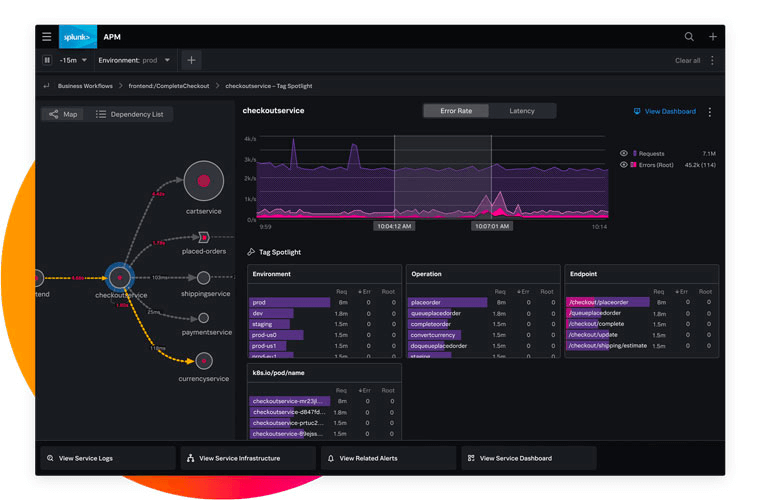
Splunk Observability
With a series of acquisitions starting in 2018, Splunk has established itself in a good spot regarding observability. They now offer several observability tools that cover most app and infra needs. Their expertise in data analytics, security, and enterprise support also benefits them in observability.
They are priced similarly to Datadog on most features. They are also constantly developing and shipping new features.
Liked for:
- They offer workload, ingest, and entity pricing options
- Works well with high ingest volumes
- Built-in dashboards and reports that can be customized
https://www.splunk.com/en_us/products/apm-application-performance-monitoring.html
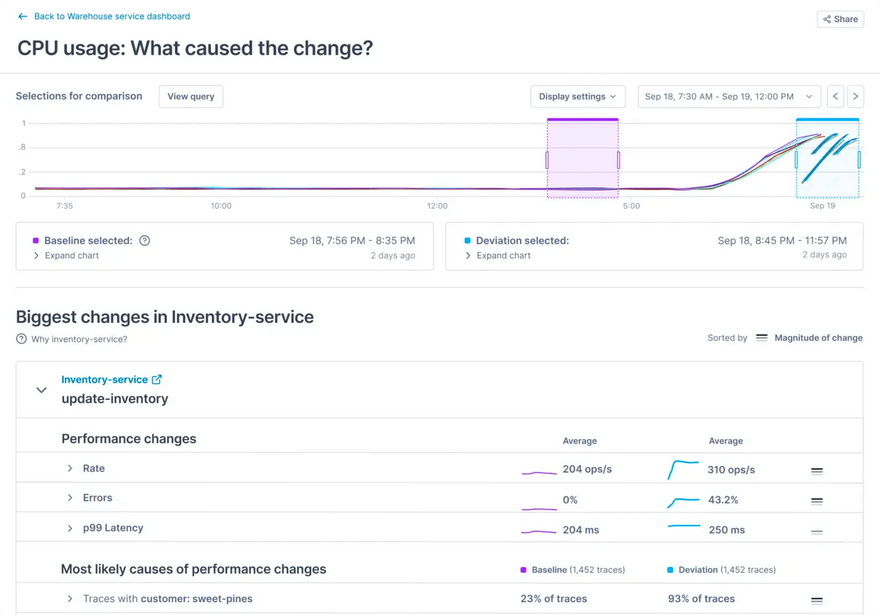
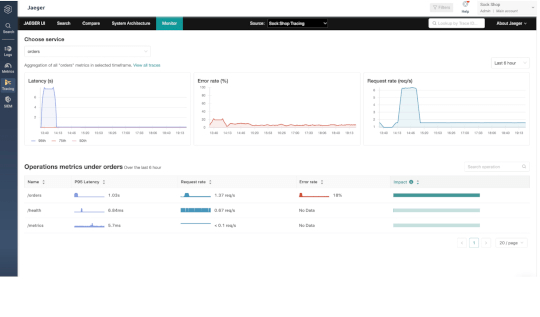
Lightstep
Lightstep is one of the top contributors to CNCF’s OpenTelemetry project, and it is a popular solution that supports the native OpenTelemetry Protocol (OTLP). The easy-to-use product covers both observability and incident response. It also comes with a ton of integrations with all your favorite tools. It is also an excellent tool for mobile app developers. Their dashboards are smart, and change intelligence shows you exactly what change affects users.
Lightstep’s incident response brings team collaboration and automatically pinpoints potential causes of the issue. It also groups alerts using machine learning and helps you stay in context throughout the incident resolution process.
They also offer observability and incident response for free, which is sufficient for small teams with moderate traffic.
Try out their neat sandbox to demo their workflow and UI.
Liked for:
- Clean and intuitive UI
- Excellent customer service, documentation, and learning material
- Support for and contribution to open-source standards (OpenTelemetry)
https://lightstep.com/observability
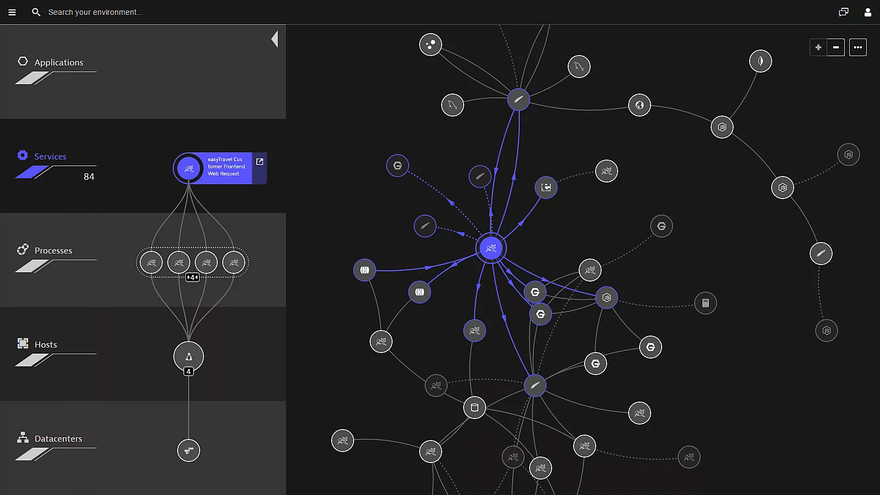
Dynatrace
Named as the Leader in Gartner’s 2022 Magic Quadrant for APM and Observability, Dynatrace’s end-to-end observability solution is robust. It integrates seamlessly with all major cloud providers and supports 600+ technologies. Its ability to be a software intelligence platform and align business, development and infra teams makes it unique.
Dynatrace can automate most manual processes and auto-deploy with a single agent that gathers data without manual scripting or additional configuration.
Users interested can get started with a 15-day free trial.
Liked for:
- Davis AI engine with software intelligence
- Real-time alerts
- Synthetic monitoring
AppDynamics by Cisco
Cisco’s AppDynamics helps companies make tech decisions through the business lens. They offer the following in one platform: Business Performance Monitoring, Application Performance Monitoring, Infrastructure Monitoring, End User Monitoring, and Database Monitoring.
There are four pricing tiers that are mostly catered toward enterprises. They have support for 100+ technologies and platforms.
Liked for:
- Useful alerts with custom actions
- Consolidated observability
- Typing business and technology metrics
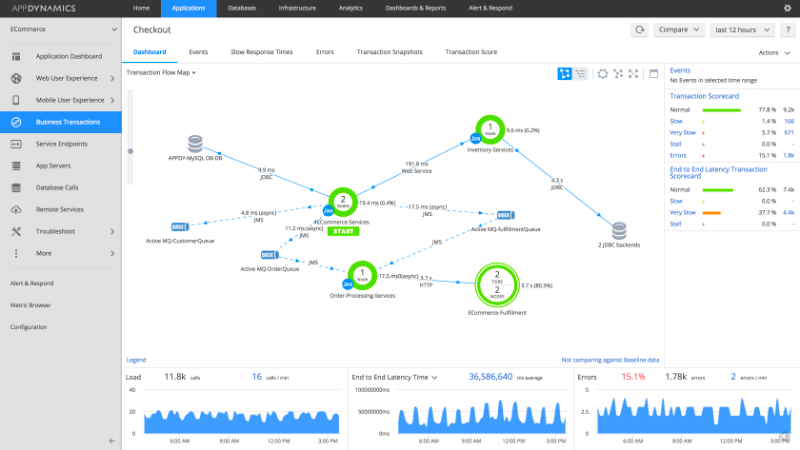
https://www.appdynamics.com/blog/product/monitoring-asynchronous-business-transactions/
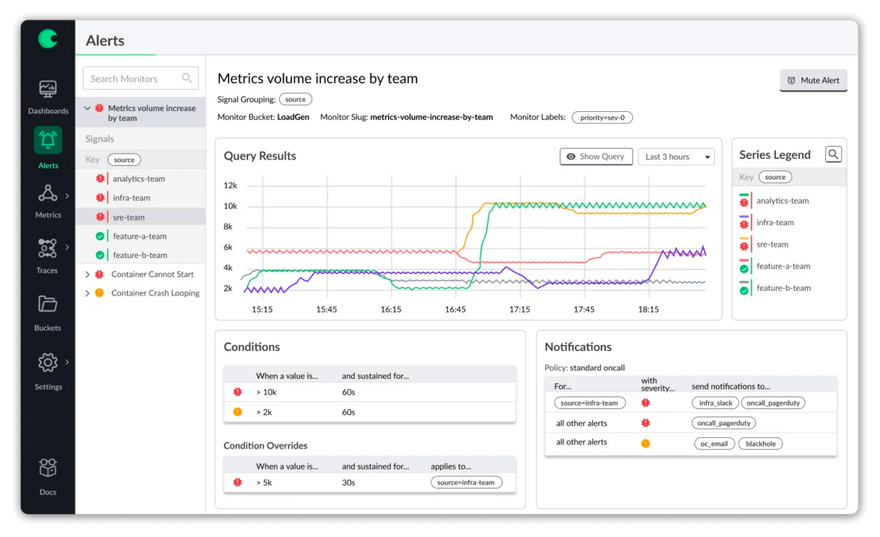
Chronosphere
After raising $200 million in 2021, Chronosphere is riding the observability wave and is on its way to becoming a significant observability player. It is built around cloud-native standards, and it eliminates the pain of scaling Prometheus.
Users of chronosphere can leverage one-click deployment with support for Prometheus, OpenTelemetry, and StatsD ingestion protocols. Grafana compatible dashboards with support for PromQL and Graphite. Ability to manage alerts with integrations for PagerDuty, Slack, OpsGenie, and webhooks. The pricing isn't transparent and isn’t available publicly.
Liked for:
- Solving the Prometheus scaling problem
- Onboarding and customer support
- Autocomplete querying and PromQL function suggestions
Useful Tools
Add these powerful tools to your observability arsenal. These tools solve specific problems really well, and some of them are even building out full-stack observability.
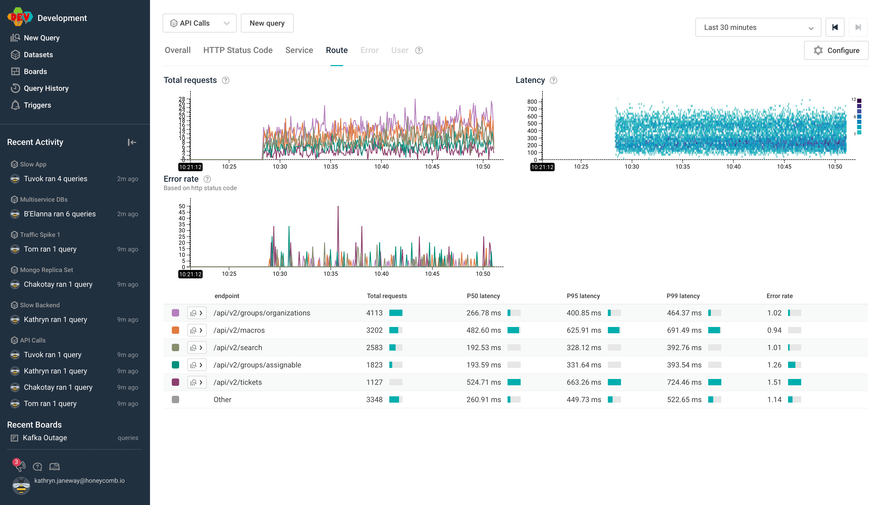
Honeycomb.io
Primary function: Bug Tracking
Honeycomb takes a whole new approach to providing high reliability by focusing on Service Level Objectives (SLOs). They offer a purpose-built data store where you can ingest data from OpenTelemetry or other preferred standards.
It can bring infra metrics and application metrics in one place. They are built specifically for Cloud, Kubernetes, and serverless systems. All their analysis is machine-learning powered and makes it easy to monitor what matters to the user with SLOs. Running queries on your data is quick and easy and doesn't require learning additional query language.
They have a free-forever plan that offers usable features, and the Pro plan starts at $130/month.
Liked for:
- BubbleUp for outlier detection
- Easy to ingest, process, and manage extensive data
- Intuitive interface and easy onboarding
Logz.io
Primary function: Log Management
If you’re not eager or don’t have the time to set up Prometheus, ELK, and Jaeger by yourself, you can use Logz. Their offerings are built on top of popular technologies like the ELK stack, Prometheus, and Jaeger.
Logz.io provides free Log management and distributed tracing options suitable for small ingest volumes from your deployments on AWS. The infrastructure monitoring and cloud SIEM features are available at an extra cost and are more catered towards higher volumes and enterprise customers.
Liked for:
- Making elastic stack easier to use
- Reliable, informative, and fast customer support
- Easy to debug and troubleshoot
https://logz.io/platform/distributed-tracing/#performance
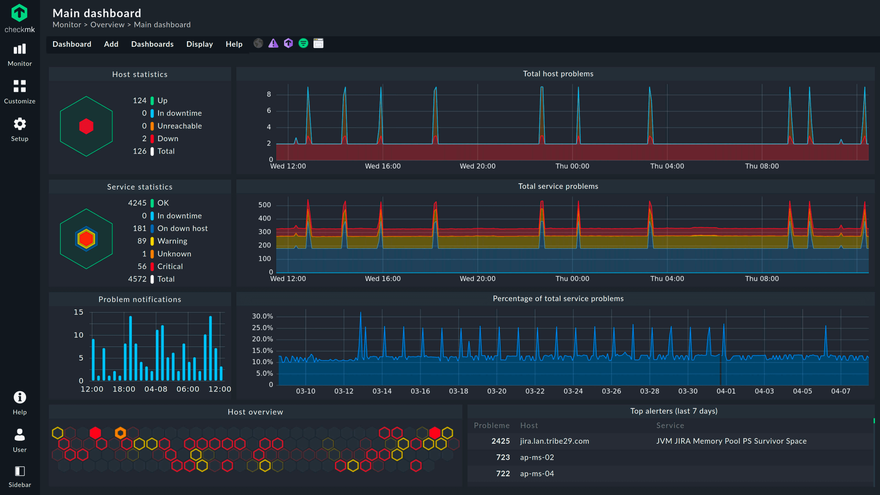
Checkmk
Primary function: Bug Tracking
Checkmk is another open-source monitoring tool with many features for companies of all sizes. It supports hundreds of packages and plugins, making it easy to get started and pool monitoring data from your stack. They offer monitoring of both traditional IT infrastructure and cloud-native IT assets. If you have network requests or IoT devices to monitor, this is the tool of choice for that.
Downloading and installing is easy as you can run Checkmk on your hardware or virtualized machines. They have packages for all major Linux distributions, Docker and Virtual Appliance.
Checkmk raw version is the free self-hosted open-source version available to all. In addition, they also have a 30-day free trial of their subscription and a free-forever tier that supports up to 25 hosts.
Liked for:
- Versatile checks with customization possibilities
- Integrations for specific technologies
- Fast and easy to get started
https://checkmk.com/product/open-source-monitoring
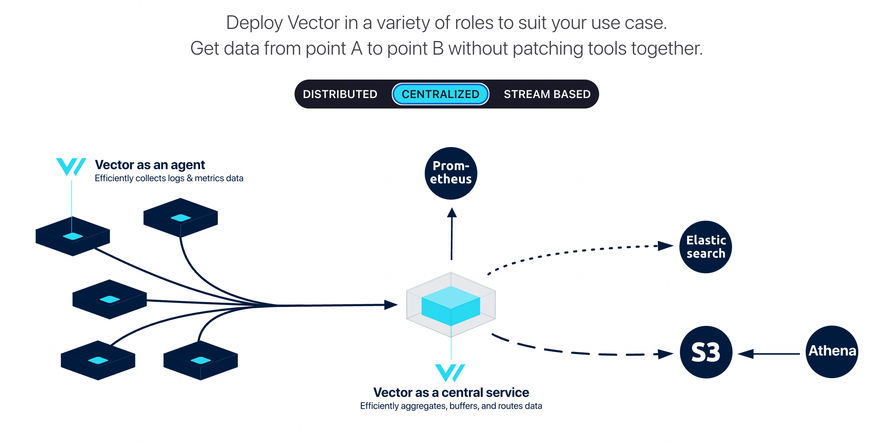
Vector by DataDog
Primary function: Observability pipeline
Vector is an open-source tool for building observability pipelines. It ingests data from various sources, then can be set up to transform and process the data as needed and deliver it in one of the 49 sinks.
Vector supports both logs and metrics, making collecting and processing all your observability data easy. Being built on RUST, it is also super fast and uses very little memory.
Liked for:
- Lock-in free and vendor-neutral
- Good documentation and easy setup
- Reliability
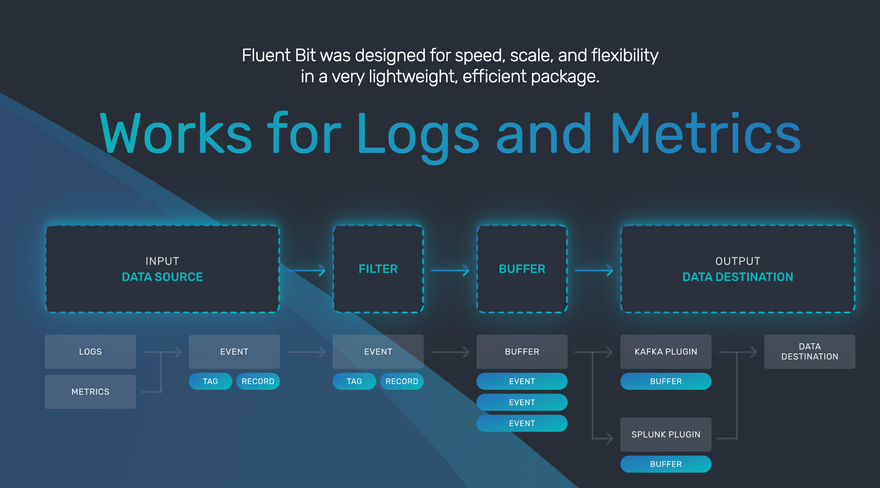
Fluentbit
Primary function: Observability pipeline
Created and maintained by the creators of fluentd, fluentbit is a lightweight, fast, and scalable logging and metrics processor and forwarder. Built specifically for the cloud and containerized environments, it allows users to collect data from any source, enrich it with filters and forward it to the tool of their choice.
Those looking for enterprise support, updates, and more can also explore Calyptia. They have two offerings; first, Calyptia Fluent Bit starts at $25 per month per node with a 50-node minimum commitment. Second, the Calyptia core version is a Kubernetes solution that simplifies data collection, aggregation, and routing at scale.
Liked for:
- Reliable and efficient stream processing
- Prometheus compatible metrics collection
- Portable and extensible
https://fluentbit.io/how-it-works/
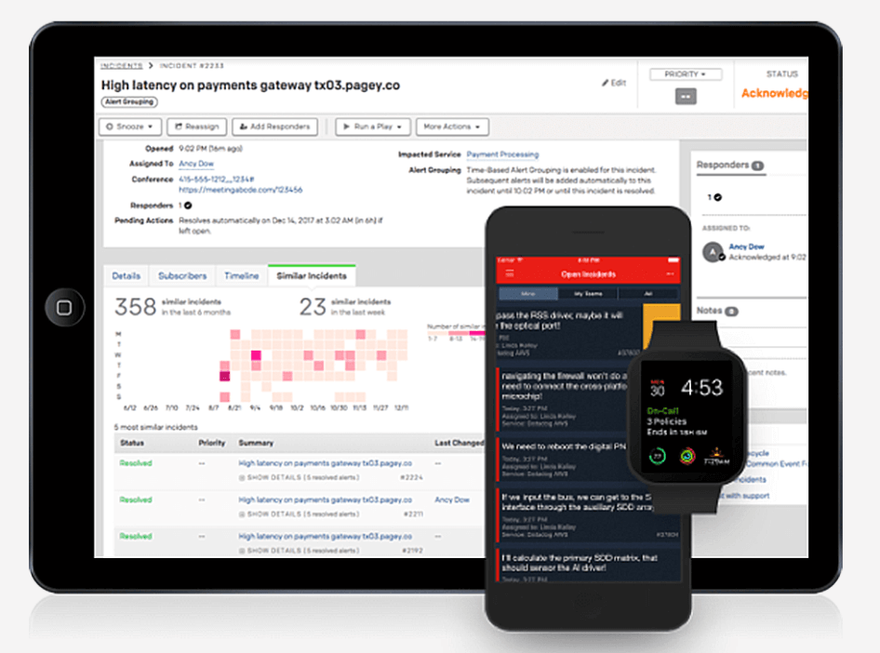
PagerDuty
Primary function: Incident Management
This wildly popular incident management tool allows companies to resolve issues faster, manage on-call schedules, automate actions, and more. With runbook automation, users can automatically run operations in any public cloud. PagerDuty also has a mobile app and 650+ integrations, so you can instantly respond to incidents. They also have automation set up for AIOps and IT process automation.
Liked for:
- Enterprise-class reliability and compliance
- Rich integrations and easy setup
- Mobile app and on-call scheduling
https://www.g2.com/products/pagerduty/reviews
Mezmo
Primary function: Log Management
Mezmo (formerly LogDNA) is a log management software on steroids. It can ingest log data from multiple sources, indexes them, aggregate and visualizes them, alert you when something is not as expected, and enrich the logs data with relevant metrics from your cluster.
It is OpenTelemetry compliant and can ingest logs and metrics from over 50 tools and platforms. They offer a free community version and three paid plans you can choose from. They have a cost calculator as well. You can use it to avoid unnecessary costs.
Liked for:
- Easy and intuitive to use
- Great documentation and support
- Searching and filtering abilities

https://docs.mezmo.com/docs/heroku-template
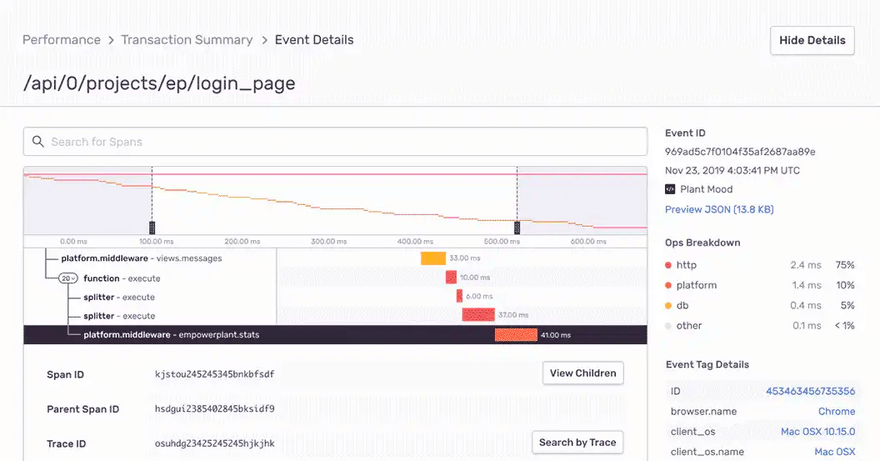
Sentry
Primary function: Bug tracking
Sentry is an error tracking software that provides a full stack view into your application and infrastructure’s performance. It makes it very easy to track and debug errors. It provides observability into both front-end and back-end projects.
Using Sentry, you can correlate bugs in your code are causing with the respective issues faced by the end-user. Sentry has a free tier for individual developers and paid options for bigger teams and businesses. You can calculate the expected cost based on your monthly error, transactions, and attachments on their pricing page.
Liked for:
- Easy integration into any project
- Shows repeated errors and weekly error reports
- Custom logs and minidump files attached to errors are easily handled
https://sentry.io/for/full-stack/
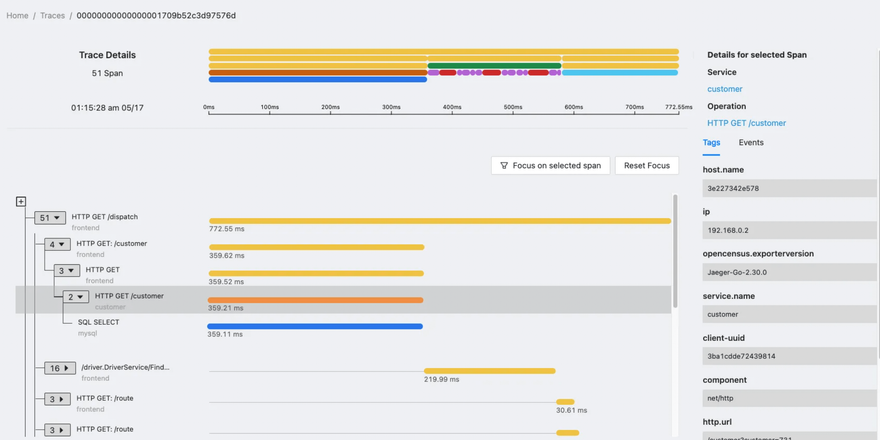
SigNoz.io
Primary function: Application Performance Monitoring (APM)
SigNoz is easy to use and open-source alternative to tools like DataDog. It comes with APM, alerting, custom dashboards, traces, and more. With over 7,400 stars on GitHub, they are one of the fastest-growing tools in the observability space.
Their Community tier is free for use and has to be Self Hosted. They also offer SigNoz cloud starting at $200/mo (tentative), which is hosted and managed by SigNoz. You pay based on the amount of data ingested.
Liked for:
- Easy to access traces from metrics
- Out-of-the-box APM metrics
- Tag-based filtering
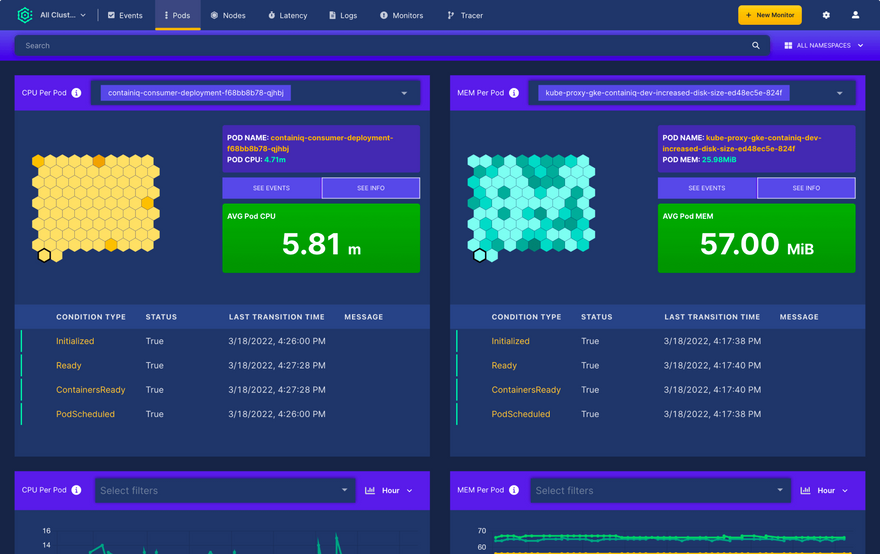
Containiq
Primary function: Kubernetes Monitoring
Kubernetes monitoring is made easy with out-of-the-box dashboards, health metrics, event & log tracking, and request tracing. Containiq’s solution offers these great features at an affordable price and a transparent model that scales based on your usage. Their power plan starts at $20/node/mo and can support up to 500 nodes with 14-day log retention. They also offer a 14-day free trial.
They currently support GKE, EKS, AKS, Fargate, On-prem, and Self-hosted Kubernetes deployments. You can read their complete requirements here.
Liked for:
- Unlimited trace ingest & event storage
- Native Prometheus integration and custom metrics exploration
- Monitoring across cloud providers
https://www.containiq.com/k8s-monitoring
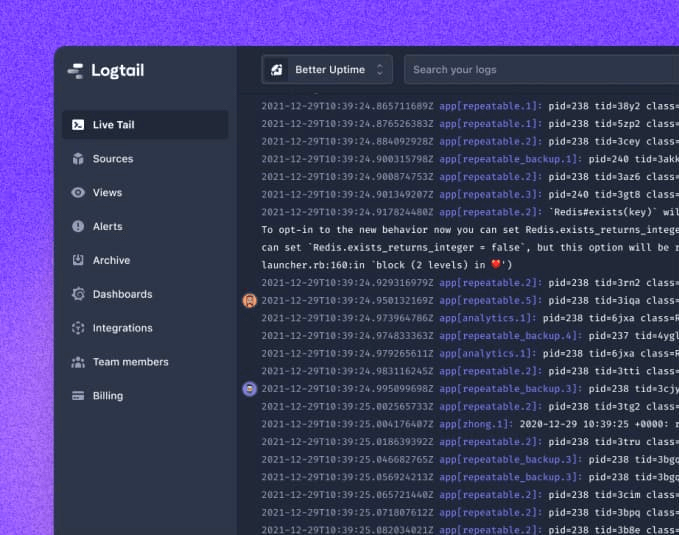
Better Stack
Primary function: Log Management
Better Stack comprises four tools: log management, uptime monitoring, incident management, and public status pages. Their log solutions are based on ClickHouse and in a SQL-compatible structured log format. It comes with hosted Grafana charts and dashboards, easy team collaboration, and filters.
Their uptime monitoring provides screenshots of errors, second-by-second timelines, and 30s multi-location checks. You can also manage your on-call schedules and alerting right on their platform. Alerting is available through voice calls, slack, email, SMS, and more.
The log management and the uptime monitoring features come with free tiers that are useful for basic usage and transparent pricing that you can choose based on your needs.
Liked for:
- Powerful SQL-compatible Query engine
- Easy to set up and its simplicity
- Quick alerts and a beautiful status page
Conclusion
For startups like yours, using the right observability tools would directly benefit key business metrics and reduce the hassle of downtimes. Many of the above-mentioned tools come with free plans and provide incredible value out-of-the-box.
While the ongoing trend is to increase the number of observability tools in the stack, your choice and need for those tools would be based on an assessment of your current stack, issues, and technologies used. Whether you choose one or many providers depends on your budget and scale. We hope this article provided information on new tools and insights to help you choose the right tools.
With Argonaut, you can quickly deploy observability tools like Grafana, Elastic, and SigNoz to your cloud environments. Moreover, you can also provision cloud infra, deploy, and manage all your apps from one place. Get started with Argonaut today!

Top comments (7)
This included a lot more tools than I originally thought there would be. Good job on the inclusivity.
Observability tools help startups see how their apps are working in real time. They help find errors fast, track performance, and keep systems running smoothly. Using the right tools can save time, cut costs, and improve user experience.
Hi a great article, But I would like to share another webpage which has more diverse information for the users on observability apm.
For all info on APM tools visit-stackify.com/application-performan...
Modern observability tools help teams monitor logs, metrics, and traces across complex systems, reducing downtime and speeding up issue resolution—an approach aligned with what Wikipedia notes about observability enabling deeper insight into internal system states. Startups often choose platforms like Grafana Cloud or Prometheus for their low cost, scalability, and ease of integration. Streamlined reporting systems such as track speed posts can further support fast visibility and performance tracking.
Hi,
I also think startups underestimate the value of simple calculation tools when analyzing performance metrics. Whether you’re reviewing uptime percentages quick, accurate math matters. I used straightforward tools like easygradecalculators.com/ to sanity-check percentage calculations during reporting. It’s simple, but having reliable numbers helps teams make smarter decisions based on clean data.
Hi,
I also think startups underestimate the value of simple calculation tools when analyzing performance metrics. Whether you’re reviewing uptime percentages or error-rate thresholds, accurate math matters. I used straightforward tools easygradecalculators.com/ to sanity-check percentage calculations during reporting. It’s simple, but having reliable numbers helps teams make smarter decisions based on clean data.
Great work. Kindly explore Middleware I think it would be a great addition to this listicle :)