When we consider adding observability to our stack, we may default to popular options like Datadog. While they have a ton of features covering most use cases, they also come with premium pricing attached to it. This blog covers a tool-wise comparison of these platforms, comments from existing users, and our recommendations for your observability stack.
Not only are observability tools costly, costing about 30% of a company’s outside vendor spending, but they also lack visibility and transparency in their pricing, making it nearly impossible to calculate how their pricing has been calculated. The various services have different pricing models, each with limits (number of hosts/devices/requests/ingest) and multiple tiers with monthly and annual billing options.
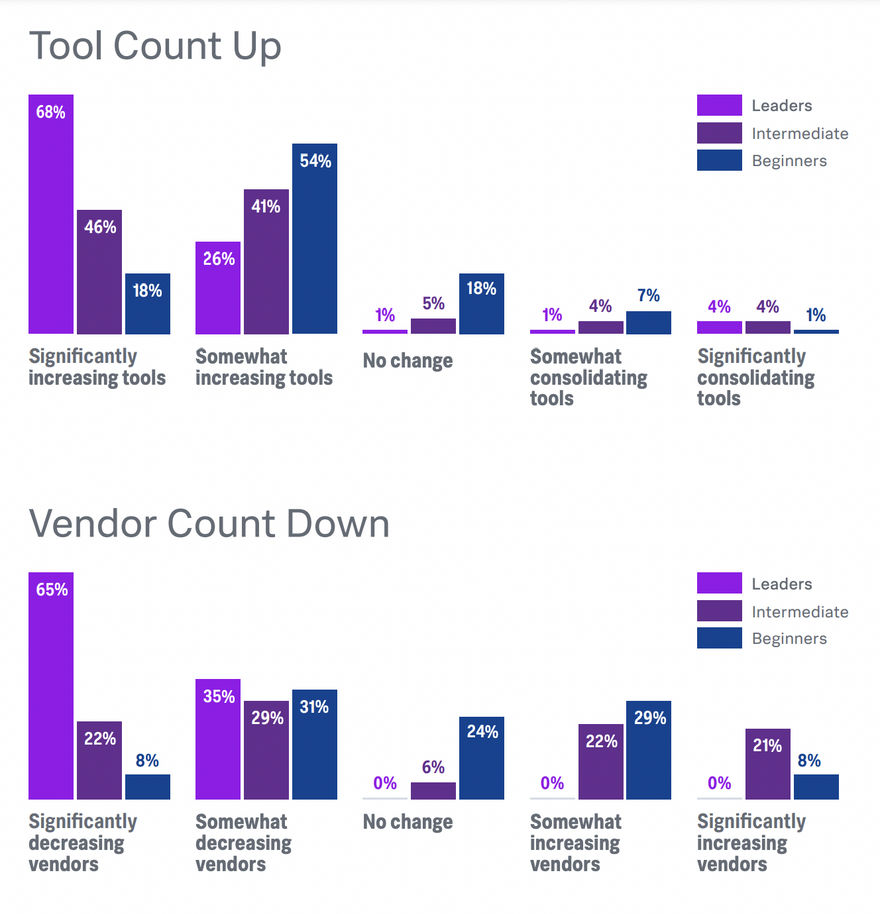
Data from Statista shows that the Observability tools market, worth $12.9 Billion in 2020, is set to reach $19.3 Billion by 2024. These tools have applications in various industries, from media, communications, financial services, technology, health, the public sector, manufacturing, etc., in all regions of the world. Organizations are also increasing the number of observability tools used while consolidating the number of vendors. (Splunk, State of Observability 2022)
Here is what users have to say
Before we dive into feature-specific comparison, let’s look at what the users of these tools have to say. These are some common likes, dislikes, and good to know we found from over half a dozen review sites, including G2, Gartner, and software advice.
New Relic
Liked:
- Straightforward setup
- Share dashboards externally
- Transparent pricing with great ROI
- AI-based anomaly detection and alerting
- Built on OpenTelemetry standards
- Go backward in time and analyze historical bottlenecks and consumption trends
Disliked:
- Complex query builder, limited regex, and other limitations of NRQL
- The learning curve to make use of all customization options can be overwhelming
- Incorrect query results, bugs, sluggish experience
Keep in mind:
- It comes with a generous free tier; use it yourself to see if it works
- Their network monitoring doesn’t yet support all infra
- Use their data ingest cost estimator
Splunk
Liked:
- Works well for high-volume data ingestion
- Indexing and ML applied to the data make it valuable
- Built-in reports and dashboards that can be customized
- Built on OpenTelemetry standards
- They offer workload, ingest, and entity pricing options
Disliked:
- Monthly pricing is expensive and opaque
- Lack of visualization options, room for improvement with their interface
Keep in mind:
- There is a 10k session/month per host limit for RUM
- If you don’t want the bundle offerings in Standard and Pro plans, you can also choose individual offerings as per your requirements
- Consider Splunk’s flexible pricing options to find the one that best suits you
- If you’re also considering using Splunk for IT Ops and Security, check their cloud platform
Datadog
Liked:
- Stability and the constant addition of new features
- Out-of-the-box integrations
- AI and ML Capabilities
- All tools in one place, with a ton of customization options
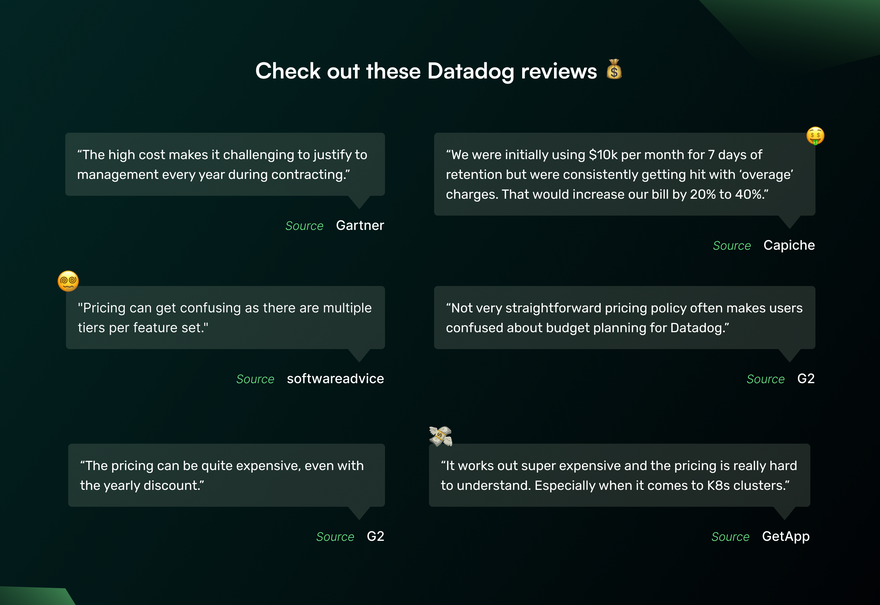
Disliked:
- Pricing is opaque, inflexible billing, and unexpected charges
- Hard to find the right metric and look at historical data
- Deploying the agents is still a very manual task
Keep in mind:
- Leverage estimated usage and set alerts to avoid overspending
- Monthly billing is 20-50% higher than annual billing
- Their security offerings are relatively new and not up to speed with the rest of their monitoring
- Their free trial is limited compared to their competitors
Moving into the comparison, we compare each tool by its features. Starting with APM & log management and ending with alerting & network monitoring.
Note: Here we only compare non-enterprise tiers. Free tiers (where available), Splunk’s Standard tier, Datadog’s Pro tier, and New Relic’s Pro tier. If you’re interested in enterprise pricing, check out their pricing pages - Datadog, Splunk, New Relic.
APM - Application Performance Monitoring
| Features | Datadog | Splunk | New Relic |
|---|---|---|---|
| Tracing | Automatic trace_Id injection to logs, connect traces to infra metrics, network calls, and live processes | Collect all trace data, AI-powered methods to sift through trace data | Observes 100% of traces and provides actionable insights |
| Live visibility | All ingested traces and service dependencies over the last 15 minutes | NoSample™ full-fidelity tracing, collecting 100% of traces combined with AI-driven directed troubleshooting makes detection time fast | Real-time streaming sends data every 5 seconds, can view, visualize and query that data |
| Control | Set SLOs, track trends, and monitor KPIs by generating span-based metrics using any set of tags | Turns every span and trace into metrics, to create pre-built service monitoring dashboards | Manage SLOs with automated service level management |
| Deploy | Monitor and compare impacts of canary, blue-green, and shadow deploy | Can have multiple, distinct application environments that don’t interact directly with each other but that are all being monitored by Splunk APM | Tracking deployments create deployment markers that appear in APM charts. |
| Supported languages | Java, .NET, PHP, Node.js, Ruby, Python, Go, or C++ applications | Java, Python, .Net (Core and Framework), Node.js, GoLang, Ruby, and PHP | Java, .NET, PHP, Node.js, Ruby, Python, Go, or C applications |
| Frameworks | hundreds of frameworks | hundreds of frameworks | hundreds of frameworks |
| Performance monitors | Applications, hosts, containers, serverless functions, and PaaS | Applications, containers, serverless functions, microservices | Applications, hosts, containers, database services, or grouping of these |
| Related products | Continuous Profiler | AlwaysOn continuous code profiling | New Relic Edge with Infinite Traces |
| Support for OpenTelemetry | Yes | Yes | Yes |
| Starting price | $ 31/month/host (Billed annually) | $55/month/host (Billed annually) Also offer usage-based pricing | Free tier, pay as you go |
Log management
| Features | Datadog | Splunk | New Relic |
|---|---|---|---|
| Ingest data from | Any source, at any scale | Ingest from any source at any scale. Separate ingest and indexed logs to reduce costs. Complement existing agents with OpenTelemetry | Any text-based data using the forwarder that works best in your environment |
| Tracking | Track trends, metrics, and KPIs from all logs | Blend logs with real-time metrics, in context troubleshooting | |
| Dashboard | Visualize summarized logs data on dashboards. create and save granular views. | Log metrics into real-time dashboards | Automatically clusters logs into patterns and detects outliers |
| Search and query | Search, filter, and analyze logs on the fly—no complex query language required | No-code search. Watch critical logs with unified filters and time controls. Easily transition between logs, traces, and metrics. | |
| Related Features | Live Tail & Logging Without Limits | Infinite Logging using S3 buckets | |
| Decouples log ingestion and indexing | |||
| Pricing | Free tier, pay as you go | ||
| Ingest | Starts at $ 0.10 per GB ingested or scanned GB/mo | Starts at $ 0.10 / host / GB ingested / mo | |
| Retention | 3-day retention starts $1.06 / million log events/mo | Standard retention is 30 days | |
| Index | Starts at $5 / indexed GB/ host /mo |
Infra monitoring
| Features | Datadog | Splunk | New Relic |
|---|---|---|---|
| Environments supported | On-premise, hybrid, IoT, and multi-cloud environments | On-prem, hybrid or multi-cloud | Cloud and on-prem infrastructure |
| Visibility | Tens of thousands of metrics, out of the box. one-click corelation of related metrics | Correlation between your hybrid infrastructure and microservices, insights for faster troubleshooting | Spot all issues and monitor performance in one place |
| Integrations | Vendor-backed integrations for k8s, serverless and 500+ popular technologies | 250+ cloud service integrations and pre-built dashboards out of the box | Close to 500 integrations are available |
| Historical records | Yes, even on resources that don't exist anymore | - | Time travel back to incident's origins and replay the historical state |
| Starting price | Limited free plan, Pro plan starts at $15 /month/host | $15/month/host | Free tier, pay as you go |
Serverless monitoring
| Features | Datadog | Splunk | New Relic |
|---|---|---|---|
| Visibility | Get all your functions in one place. | Pre-built visualizations | Visualize, trace, alert |
| Real-Time | Ingest, search, and analyze 100% of traces live over the last 15 minutes. Real-time alerts on memory, timeout, and concurrency metrics | Monitoring and alerting on every function | - |
| Metrics monitored | 1. Cold starts 2. Errors 3. Memory 4. Timeout and latency 5. Concurrency and custom metrics for CX | 1. Cold starts 2. Errors 3. Invocations 4. Compute duration 5. Custom business & CX metrics | 1. Invocations 2. Errors 3. Spans 4. Custom metrics |
| Supports | Lambda, Google Cloud Functions, Azure Functions, AWS SAM, Serverless Framework, and AWS CDK integrations | Lambda, Google Cloud Functions, Azure Functions | Lambda, Google Cloud Functions, Azure Functions |
| Test in CI/CD pipeline | Yes, Integrate to CI/CD pipelines | Yes, automatically pass/fail builds based on the performance budget in your CI/CD pipelines | Yes, Integrate to CI/CD and build pipelines |
| Pricing | Workload monitoring starts at $5 / active function/mo | Usage-based pricing | Free tier, pay as you go |
Real user management
| Features | Datadog | Splunk | New Relic |
|---|---|---|---|
| Visibility | Web apps, Native mobile apps, app backends | Web apps, Native mobile apps, app backends | Browser monitoring and mobile monitoring |
| Core web vitals | Yes, page load, interactivity and visual stability. Filter by location, device, etc. | Yes, page load, interactivity and visual stability. Filter by location, device, etc. | Yes, page load, interactivity and visual stability. Filter by location, device, etc. Set alerts when vitals drops. |
| Full session analysis | Contextualize user sessions attributes like user ID, email, and name. Ingest custom metrics and track business-critical user actions | Including route change, API calls, impact of images and resources on user | See trends with sessions, filter by app and device versions |
| Native mobile apps | Troubleshoot app crashes, set up alerts, connect server-side and client-side metrics | Auto capture common client attributes - app crash report, full app lifecycle visibility, network requests and errors | Insights into crashes, handled exceptions, and network failures |
| Session replay | Yes, 30-day retention policy | - | Reproduce incidents using event trails and mobile breadcrumbs |
| Integrates with | logs, APM, profiler | Splunk APM for Backend visibility | |
| Pricing | Starting at $ 0.45 / 1,000 sessions / month* | Starting at $ 14 / 10,000 sessions / mo | Free tier, pay as you go |
Synthetic monitoring
| Features | Datadog | Splunk | New Relic |
|---|---|---|---|
| Locations | Simulated requests and actions from around the globe, and synthetic private locations | Run simulated tests from nearly 50 global locations | Simulate traffic across thousands of public and private locations |
| Monitor types | Allows single and chained requests at these levels: HTTP, SSL, DNS, WebSocket, TCP, UDP, ICMP, and gRPC health check. | Request level, run level metrics, test-level, page-level, transaction-level metrics | Broken links, certificate check, ping, step, simple and scripted browser monitors, and API tests. |
| Troubleshooting | Get full context for troubleshooting failed test runs with correlated metrics, traces, and logs | Track and report SLOs and SLAs for uptime and performance. 300+ optimization recommendations to fix defects and improve UX | Identify issues from a third party, backend service, and infrastructure. Improve end-user experience with user-centric metrics |
| Record | Record browser tests and monitors customer experiences with end-to-end tests | Capture screenshots and simulated sessions. Configure test schedules and set up alerts. | Scripted browsers tests are driven by Selenium WebJS to emulate customer navigation, action, and more |
| Test in CI/CD pipeline | Yes, Integrate to CI/CD pipelines | Yes, automatically pass/fail builds based on the performance budget in your CI/CD pipelines | Yes, Integrate to CI/CD and build pipelines |
| Starting price | Uptime Tests $1/mo/ 10,000 requests (billed annually) | Free tier, pay as you go | |
| API Tests $ 5 /mo /10,000 test runs (billed annually) | API Tests $ 4 /mo/10,000 test runs (billed annually) | ||
| Browser Tests $ 12 /mo /1,000 test runs (billed annually) | Browser Tests $12/mo/1,000 test runs (billed annually) |
Alerts and incident management
| Features | Datadog | Splunk | New Relic |
|---|---|---|---|
| Notifications | Datadog's web & mobile app, Slack app, Hangouts Chat, and Microsoft Teams, and more | Meta-data-rich alerts on any device, incl. iOS, and Android apps | Smart detection distinguishes between critical and minor concerns. Scheduling and muting capabilities are also available |
| Automation | Automatically apply alerts to new hosts, and detect anomalies in apps, infra, and services. Automated incident management workflows | Automate scheduling, time-sensitive actions incl. escalations, war room, and post-incident resolution | Baseline conditions automatically adjust based on the system's behavior. Anomaly detection. Automatically sets permissions, no personal data collected. |
| Context | Describe the incident and pass on assessment fields such as root cause, detection method, services, etc. | Identify similar incidents using historical insights and audit trails. Use resources like run books, articles, and dashboards to help responders triage and resolve incidents faster | You can include charts about the incident to provide context |
| Custom triggers | With an Anomaly monitor, set anomaly detection, trigger window, and recovery window. Advanced options with seasonality, algorithms available | Rules Engine is a full-stack service level feature that allows you to set certain conditions, and trigger custom action | Set alert conditions specific to data sources or data behavior thresholds |
| Integrations | 100+ integrations works with your existing workflow | 100+ integrations out-of-the-box | Yes, all major integrations |
| Reports | Create, track, and report on critical SLOs and visualize them on dashboards | Post-Incident review, MTTA/MTTR performance report, On-call report, Incident frequency report | |
| Starting Price | $20/user/mo (billed annually) | Up to 10 users - $ 5/user/mo (Billed annually) | Free tier, pay as you go |
| 10+ users $23/user/mo (billed annually) |
Splunk On-Call was previously VictorOps, which was acquired by Splunk in 2018.
Network monitoring
| Features | Datadog | Splunk | New Relic |
|---|---|---|---|
| Visibility | Monitor the performance of connections among your hosts, services, virtual private clouds (VPCs), and other elements of your on-prem, public, or private cloud. | - | Analyze all of your network, app, infrastructure, and digital experiences on a single platform |
| Network metrics | Traffic between any two endpoints, TCP retransmits, latency, connection churn, | - | Network syslogs, Network flow logs, cloud flow logs |
| Device Metrics | Automatically discover and collect metrics on your network from any device, drill down and create custom views to evaluate device performance | - | Device performance via SNMP |
| Forecasting | Use forecasting to determine when interfaces will exceed their available bandwidth | - | |
| DNS | Analyze system-wide DNS performance, Assess DNS server health with request-volume, response-time, and error-code metrics, | - | - |
| Starting price | Network Performance Monitoring $5 /mo/host (billed annually) | Free tier, pay as you go | |
| Network device monitoring $7/mo/device (billed annually) |
- New Relic’s solution is based on the ktranslate docker container. This single container image is hosted in your environment to collect and process your data to be exported to the Event, Metric, and Log APIs and displayed in New Relic.
As we can see from all of the above charts, Splunk and New Relic have nearly caught up to the offerings of Datadog on most fronts. Through their recent push towards observability, recent acquisitions, contributions to open-source projects, and partnerships. They also offer aggressive pricing, which undercuts Datadog’s and other expensive competition on most fronts.
Choosing your observability stack
As the business impact of outages rises day by day, more and more businesses are likely to spend on Observability tools. While the above comparisons give you a basic overview of which tools to use and how much each might cost, here are a few considerations to keep in mind while choosing the observability tool.
- Analyze which parts of your stack needs monitoring the most, then analyze and try out tools specific to that need. There are open-source and free tiers tools available for most of these features.
- Infrastructure
- Networks
- Application performance
- End-user experience
- Alerting
- Understand which pricing model works best for your current infra setup. Each vendor has different pricing models, so try out their free trials and see if their ease of use and transparency in pricing is comfortable for you.
- Workload-based pricing
- The volume of telemetry ingested
- Number of users
- Event-based pricing
- If you’re not quite ready for enterprise volume discounts, look to use multiple tools from different vendors. More than half of the customers surveyed use ten or more tools.
- Work on your existing strengths. Enterprise customers using these tools have dedicated IT teams set up for monitoring. As a smaller company looking to build on the cloud, leverage automation where possible so you can spend more time on your code and less time watching your systems.
- Try installing tools like Prometheus and Grafana to understand how much work it is before testing a tool like Datadog. This will help you understand if the time saved using these tools is worth the money you’ll spend on them.
- Have a way to train your team, and make it easy to onboard new employees into your stack. Once your observability stack is up and running, it is important to have good getting started guides (internal or external), which can help your team learn and work with your observability tools easily.
Conclusion
Choosing between Datadog, Splunk, and New Relic can be difficult as they have similar offerings at first glance. But, there are a few things each platform does better than the others. Using the feature-level comparisons and considerations mentioned above, you can narrow down and make the best decision that saves cost and works well with your stack.
While there is no shortage of observability tools in the market today, choosing from prominent vendors has its advantages in terms of compatibility, cost, and easier monitoring. And that's why companies today are choosing to consolidate their vendors.
If you are interested in seeing the progress the industry has made in the past 12 months and where it is headed, check out this insightful blog by Hayden James.
Argonaut removes the complexity out of your app and infra deployments. You can also integrate third party apps like your favorite observability tool. Get started with Argonaut today.

Latest comments (2)
This is a great post! It's refreshing to see a straightforward look at Datadog, New Relic, and Splunk. It’s a helpful way to find out which tool works best for monitoring apps and solving issues quickly.
Some comments may only be visible to logged-in visitors. Sign in to view all comments.