
Plausible is a lightweight web analytics tool used to check your web traffic and also pinpoints from where the traffic comes from with clear visual charts and Email/Slack reports.
In this blog I used next.js for reference to show how plausible works, but plausible will work on any framework.
Login/Create
Create a plausible account to get started and click the add website button.
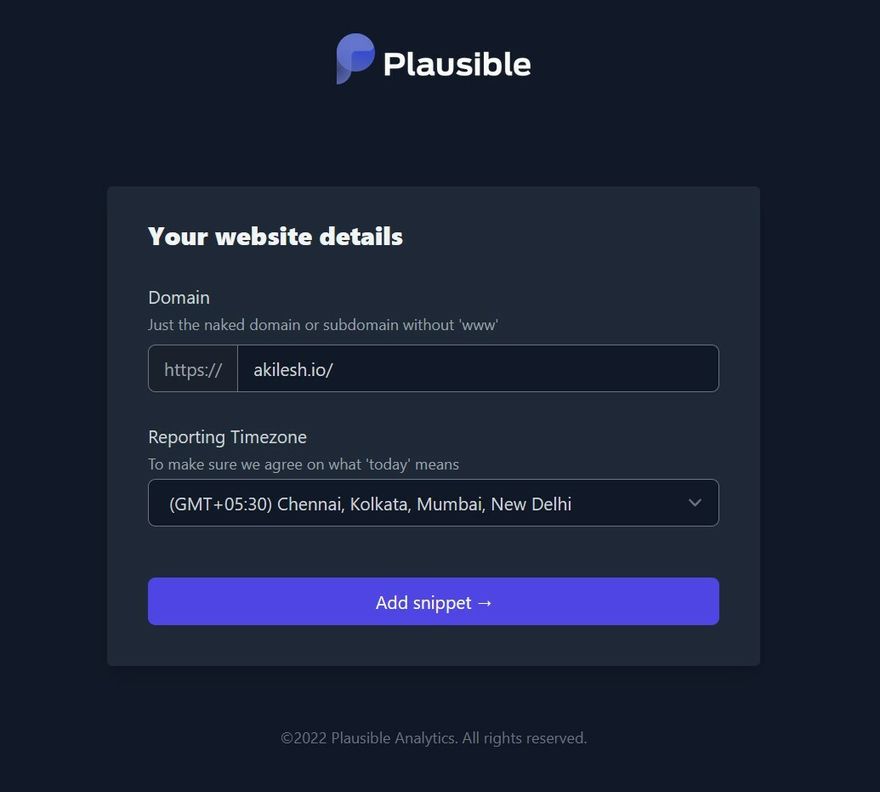
Add a website
Enter your domain name in the text area (provide the domain name which you have access to) and location will be automatically set accordingly to your device location.
Code snippet
A code snippet will be generated from our previous details, and it needs to be pasted in our project's head.
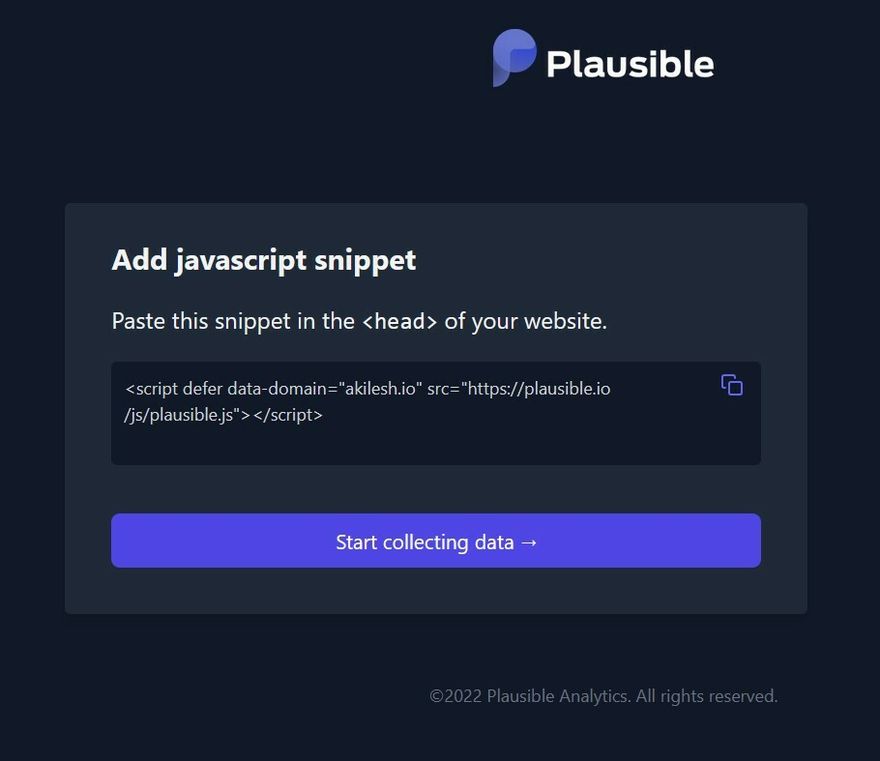
Let's add this script to our project in our way.
Create a meta.tsx file under the components directive and paste the below snippet.
import Head from 'next/head'

export default function Meta() {
    return (
        <Head>
            <script
                defer
                data-domain="akilesh.io"
                src="https://plausible.io/js/plausible.js">
            </script>
        </Head>
    )
}
Now you can import this meta component to your layout.tsx component if you have one. If not, you can add it to this component to other components which have access to all the pages.
The ides here is to make the
<script>tag accessible by the whole application.
Domain dashboard
Go to your domain dashboard https://plausible.io/**your_domain_name** and stay relaxed. Plausible will handle all the complicated process and in a few seconds you will see your webpage's stats.
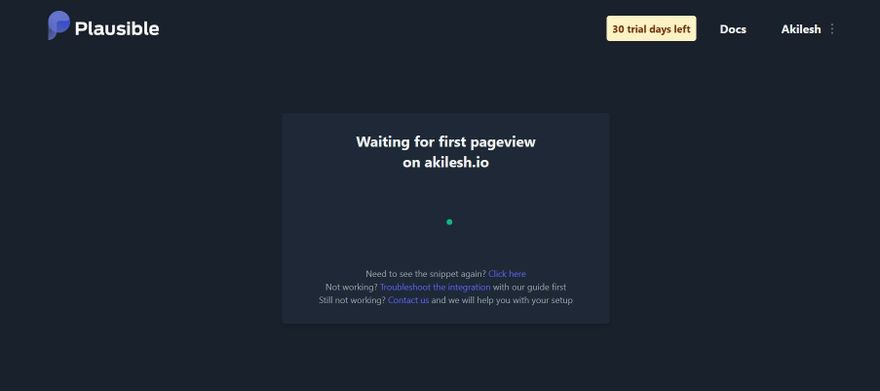
Screen shot:
This will be your dashboard until you get someone to visit your website.
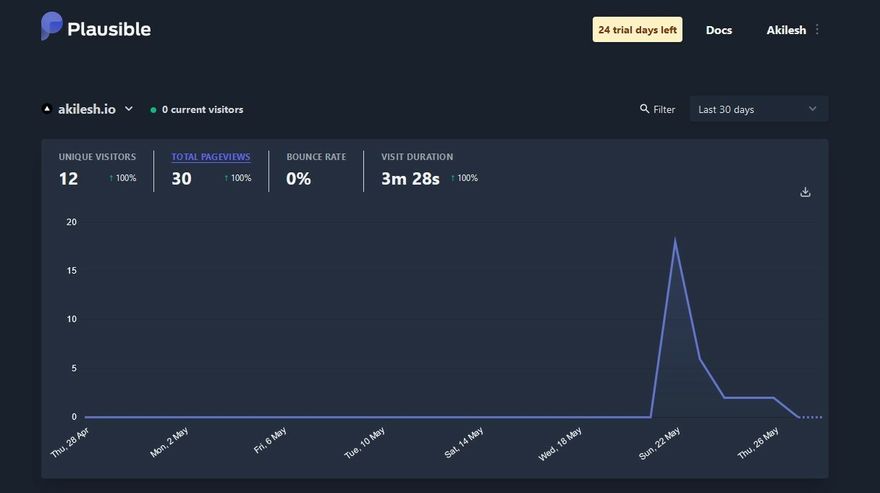
This is a line chart represents about the total visitors and also will identify unique visitors from the total traffic then the duration of the visiting period.
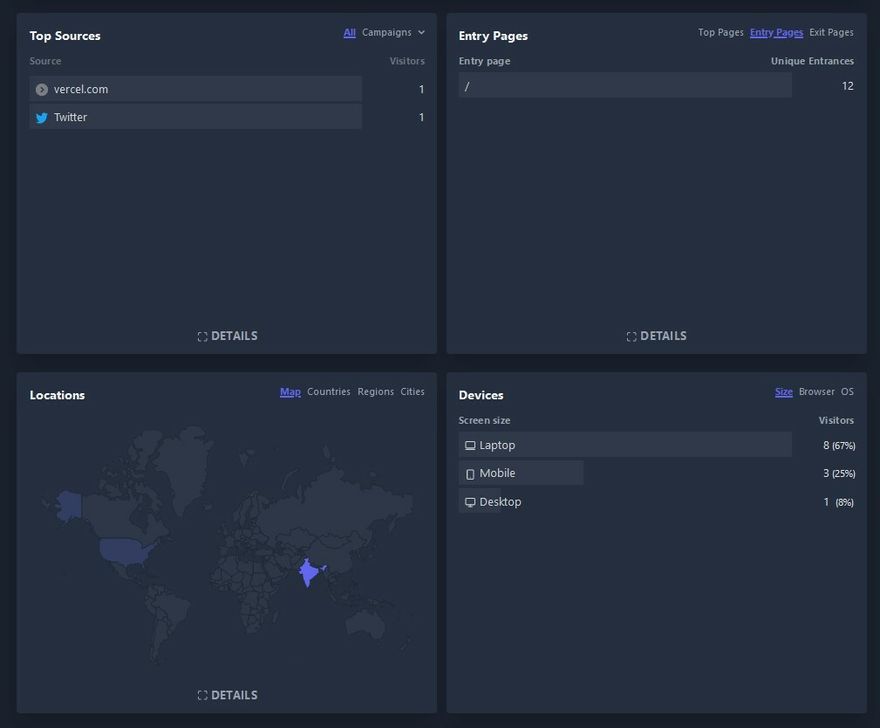
This dashboard will give a detail representation
Top Sources (From where the traffic comes).
Pages (On what page the user entered, exit).
Location.
Devices, Browser, OS.

Top comments (0)