In PVS-Studio 7.18, the compiler monitoring utility for Windows got new mechanism that completely eliminates missed compiler launches. In this article, we will remind you how our analyzer copes with various build systems and tell you about the implementation of the new Wrap Compilers mode.

Introduction
There is a wide variety of build systems and compilers for C and C++ development. When it comes to static analysis, it makes sense to focus on the most common development tools that are popular among the large number of developers.
However, we can't ignore a large number of developers who use less common toolkits. These toolkits may include specialized compilers and toolchains, development and debugging environments for Embedded systems.
Many these tools do not provide the ability to expand their functionality with third-party components. For other tools, the direct integration of the analyzer will take a lot of effort. What can we do in this case?
PVS-Studio has compilation monitoring mechanisms to gather information necessary for analysis. And this silver bullet allows the analyzer to interact with a wide (and potentially any) set of various build tools.
Depending on the tools provided by the operating system, we distinguish two approaches for the compilation monitoring process: compilation tracing for Linux and compilation monitoring for Windows. When using the monitoring mechanism of the CLMonitor utility under Windows, users could encounter an issue: the analyzer sometimes missed random source files.
This article describes how compilation monitoring utilities work, what was the reason for the analyzer to miss files compiled under Windows and how we managed to fix the issue. But first, let me explain why we need to gather some "necessary information for analysis" at all.
Why we can't just take and analyze the file that contains code
Well, what should a C or C++ analyzer do when you run it on your project? The answer to this question will help identify the problems we face and talk about solutions.
Let's try to analyze the source code of a simple main.cpp file:
#include <iostream>
int main()
{
  std::cout << "Analyze me!";
}
What does this code fragment tell us?
Well, we see the main() function, in the body of which the operator '<<' is called. There is a string literal and a semicolon.
And what is std::cout? And why do we even apply a shift operator to this std::cout, and the operator has a string inside?
Of course, all these details need to be declared somewhere, or better yet, defined.
Almost any C++ developer knows that the declarations of std::cout and other things will appear after the so-called preprocessing. Preprocessing results in recursive inclusion of the header files specified by the #include directive. Without preprocessing, after which the necessary definitions in the translation unit become visible, there is actually nothing to analyze. Except, it is possible to write a regex-based linter that does not really understand how the code being analyzed works.
It turns out that the analyzer needs to "just" do the preprocessing itself.
Let's read about 1-6 phases of translation and implement our own preprocessor. And when it's time to run it...it can't work with any build system! The problems can be listed, starting with the fact that it is not clear where we get the header file from.
When you install your favorite compiler, it usually comes with a standard library implementation. That way the compiler knows where it needs to look for files from its own library. But the analyzer doesn't. And each time you have to specify the paths to the directories with the included files for the analyzer.
The built-in preprocessor definitions or definitions set by the build system affect the preprocessing as well. These definitions can control conditional compilation (the #if, #ifdef, etc.), that decides what code should be compiled and what code should be cut out depending on:
• a platform;
• a build configuration;
• any other reasons.
Configurations that control the compiler are passed from the build system via command line parameters, or startup flags, or the so-called response file. By the way, these flags are not defined by any standard. Build systems are simply designed to pass parameters with pre-known formats.
There is a trap: to process some arbitrary source file, it is necessary to make a superpreprocessor that:
• can pretend to be a native preprocessor for any build system;
• knows where the necessary include files are located;
• understands any arguments and can execute non-standard (and undocumented) functions of all known (and not so known) preprocessors.
So how can the analyzer meet all these requirements? Of course, it can't. At least by itself.
The trick here is the following: you need to learn the compile command from the build system to compile the source file. Then you call the compiler using that command, but add a couple of settings that will make the compiler do the preprocessing for us. It turns out we don't need to make our own preprocessor. For preprocessing, we can use an existing compiler that will figure out what to do with the source file by itself.
So, the long story short — to accurately repeat the compiler launch for preprocessing, you need to:
• extract the path to the compiler executable file;
• find out the command line arguments of the launch;
• save the original working directory;
• save environment variables.
Let's look at ways in which this could be accomplished.
How to (not) get compile commands
So, we need to know what parameters the build system runs the compilers with. The most straightforward scenario would be to simply take and parse the build system files that store information about the structure and build of the project.
This is how PVS-Studio for Visual Studio works. In this case, we're lucky because the parsing of the .sln and .vcxproj project files falls on the shoulders of Microsoft.Build (SolutionFile and Project classes). The classes parse the solution/project file and return a list of compilation commands that can be passed to the analyzer.
This is one of the first approaches that was used in PVS-Studio. This approach works well with Visual Studio and covers needs for the bulk of the users.
Unfortunately, it can be difficult to deal directly with any arbitrarily chosen build system:
• you need to support a huge variety of project file's formats;
• there may be no specifications for them at all, or some of the information may be undocumented;
• implementation details may vary from version to version of the build system;
• in principle, some tools are difficult to get for testing for one reason or another.
Imagine creating a CMake backwards that will make one format out of a bunch of different formats to control the analyzer.
The problem of supporting a variety of build systems was especially relevant when we were developing the analyzer for Linux. Working with Linux, programmers often use a bunch of different tools to develop and build their projects. And the definition of the structure of projects can be very vague. For example, a makefile contains a script in its own language that should just "make" some commands. Often, without the direct building, it is impossible even to immediately identify the source code files for analysis. Some of the files may not initially exist — their location may be found by external utilities. Other files may be generated by templates during the build process... some kind of "higher-order preprocessing".
Well, playing cat and mouse with build systems is such a thankless task.
Monitoring and tracing
Just as with preprocessing, it so happens that the most universal way to interact with the build system is to completely abstract from it. Why deal with all these wrappers over the project build if you only need to know specific compile commands? Is it possible to simply ask the operating system what processes it start launching and filter out only information about compiler launches?
If you use Linux, this can be done using the strace utility. When a user starts preparing for analysis via 'pvs-studio-analyzer trace -- cmd_to_build_your_project' using the guide , the strace utility is called with the necessary set of options. Then strace calls 'cmd_to_build_your_project' and writes to the file all system calls related to the launches of the generated processes. This file helps us to track the hierarchy of the project's build processes. That's why this mode is called tracing. It collects information sequentially, from those processes that starts processes to the ones being started.
Unfortunately, there is no strace utility for Windows, and we could not find a good alternative. We had to make an application called CLMonitor. Based on WinAPI calls this app "monitors" the list of running processes and try to extract the necessary information from them. Just like task manager. It looks like a set of dirty hacks, but it works :)
In general, compiler launches are intercepted and PVS-Studio collects the necessary information. However, this system has a critical drawback. The monitoring mode is too passive, which leads to interception misses occurring for the following reasons:
• the polling of running application may not be able to track the launch of a process, if the process starts and finishes too quickly;
• if the process can be tracked, there is no guarantee that it will be possible to collect information about the process before its stop;
• when the parameters of the launch are not passed through the command line, but through a special temporary response file, and if this file might be deleted faster than the monitor gets to it — the launch command is useless.
These drawbacks are especially noticeable on projects that are built quickly, such as those written in C for Embedded. On a test project of 10,000 empty translation units on my work computer, the number of misses was up to 60%!
Gotta Catch 'Em All
The PVS-Studio team tried to solve this issue, trying different approaches, but they were not very successfully.
For example, using the Event Tracing for Windows (ETW) mechanism, the system and different applications can exchange messages. Providers can create events with data that are processed by consumers. It would be logical to assume that it is possible to find events containing the information we need.
You can find the list of registered providers with the PowerShell command:
Get-WinEvent -ListProvider * | select name
There are many providers and someone may provide us events about the launch of processes. For example, Microsoft-Windows-Kernel-Process. Yes, this provider does issue events about the launch of processes with the path to the executable file, the ID of the created process (PID), and the parent's PID. But there is no command line and working directory in this type of event:
<Event xmlns="http://schemas.microsoft.com/win/2004/08/events/event">
  <System>
    <Provider Name="Microsoft-Windows-Kernel-Process" Guid="{....}"
     />
    ....
  </System>
  <EventData>
    <Data Name="ProcessID">    7520</Data>
    <Data Name="ProcessSequenceNumber">296913</Data>
    <Data Name="CreateTime">2022-03-29T07:06:53.228244700Z</Data>
    <Data Name="ParentProcessID">   10252</Data>
    <Data Name="ParentProcessSequenceNumber">296903</Data>
    <Data Name="ImageName">....\Windows\System32\notepad.exe</Data>
  </EventData>
  <RenderingInfo Culture="en-US">
    <Level>Information </Level>
    <Opcode>Start </Opcode>
    <Keywords>
      <Keyword>WINEVENT_KEYWORD_PROCESS</Keyword>
    </Keywords>
    <Task>ProcessStart</Task>
    <Message>Process 7520 started at time ....</Message>
    <Channel>Microsoft-Windows-Kernel-Process/Analytic</Channel>
    <Provider>Microsoft-Windows-Kernel-Process </Provider>
  </RenderingInfo>
</Event>
Since we couldn't find "regular" ways to collect the necessary information, we had to reinvent the wheel. For example, we could launch a source build process with a DLL injection, which would proxy CreateProcess calls, save the required information, and run descendants with the same injection. This would be analogous to the tracing mode on Linux. Maybe someday we'll try to do that.
The license may not allow you to use an external event collection utility like Process Monitor, and this approach does not solve issues with response files.
One of my teammates was trying to develop a kernel-level driver to intercept launches of processes. For example, many game anti-cheats do this to detect suspicious activity in the system and prevent debugging and reversing the game process. Unfortunately, the developments didn't go into production, since the company don't have much experience in supporting such solutions. Actually, that's too TOUGH. In addition, errors in the kernel-mode driver can lead to obvious problems: from unstable system operation to vulnerabilities. For example, exploiting the driver's weaknesses, you can achieve the execution of arbitrary code with elevated rights, as it happened with Capcom.sys.
Another colleague recently shared information about another not so documented but interesting thing — Image File Execution Options (IFEO). It subsequently made it possible to successfully implement a reliable process launch interception.
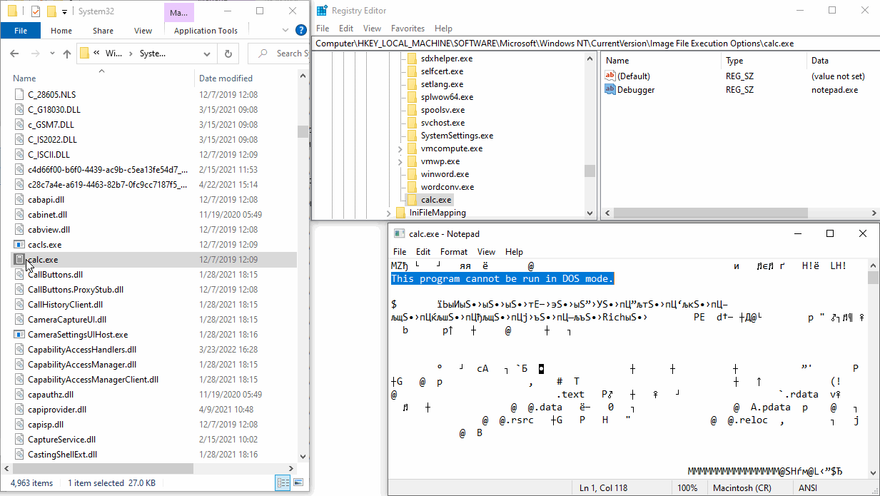
In the Windows registry there is a path — 'HKEY_LOCAL_MACHINE\SOFTWARE\Microsoft\Windows NT\CurrentVersion\Image File Execution Options\'. You can add a new key with the name of some executable file to this path. Let's the file's name will be 'calc.exe'. Now, if you create the 'Debugger' string field with the 'notepad.exe' value in this key, when you launch the calculator, a Notepad window will open instead — with the text of the binary executable file of the calculator. It's a quite an interesting behavior.
It turns out that instead of launching one program, we can launch a completely different one by passing the launch string of the original program. So instead of calling the following command:
OriginalExecutable.exe --original-arguments
This command is called:
MyProxyExecutable.exe OriginalExecutable.exe --original-arguments
Wrap Compilers Mode
Using the described mechanism, you can make a special wrapper program that can be launched by the build system and not by its native compiler. At the same time, such a trick will be completely transparent to the build process. The wrapper will have the required environment, a working directory, and a list of command-line arguments to run. And this is exactly what we need.
Once the wrapper is successfully infiltrated in the build process, we are free to decide what to do next. You can slowly (within reason) contact some arbiter server, which accumulates information about individual compilation runs, and also read the created response files. In order not to break the further build process, the wrapper still needs to run the compiler process with the original parameters. At the same time, the wrapper needs to forward the I/O streams to make the display of warnings and compilation errors work, and forward the return code received upon the process completion.
To enable the new interception mechanism, you need to pass the '--wrapCompilers' flag when starting the CLMonitor server in 'trace' or 'monitor' mode with a list of monitored compilers:
CLMonitor.exe trace --wrapCompilers cl.exe
In the graphical interface, we added a field to specify compilers:
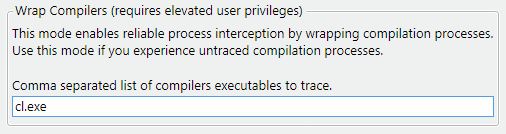
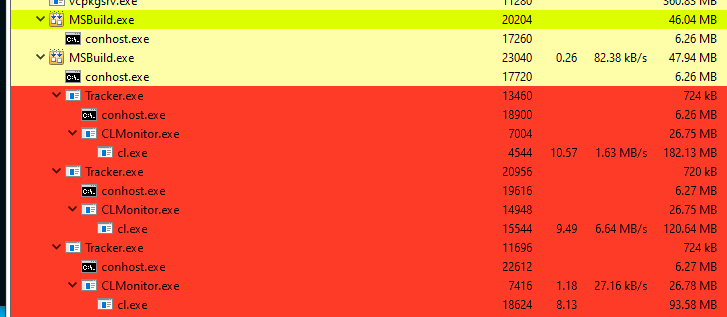
Next, wrappers will be registered in the Windows registry for the specified compilers. The wrappers will be embedded in the build process tree and start sending information to the server.
After the build is completed and the server is stopped, the registry will return to its original state and the analysis of the tracked files will begin. Everything is going according to plan.
Details of the wrapper implementation
There is one interesting pitfall. If a debugger application launched via IFEO directly starts the process to which it was attached, another wrapper will be started instead of starting the desired process. Then this wrapper will launch another one... and so recursively. To avoid this, the wrapper must disable the launch of the debugger on the generated process. This is done by accessing WinAPI. We have it imported into the Native class. You can take definitions of the necessary structures and functions from PInvoke.net.
Below is a snippet of C# code that starts the process. Error handling is cut out for briefness.
static uint StartWrappedProcess(string commandLine)
{
  // Setting the current I/O streams to the process to be started
  // so that it can interact with the parent process
  var sInfo = new Native.STARTUPINFO();
  sInfo.hStdInput = Native.GetStdHandle(Native.STD_INPUT_HANDLE);
  sInfo.hStdOutput = Native.GetStdHandle(Native.STD_OUTPUT_HANDLE);
  sInfo.hStdError = Native.GetStdHandle(Native.STD_ERROR_HANDLE);

  // A couple of necessary structures to launch the process via CreateProcess
  var pSec = new Native.SECURITY_ATTRIBUTES();
  pSec.nLength = Marshal.SizeOf(pSec);
  var tSec = new Native.SECURITY_ATTRIBUTES();
  tSec.nLength = Marshal.SizeOf(tSec);
  var pInfo = new Native.PROCESS_INFORMATION();

  // Creating a process
  // Disabling the further debugger call so as not to go into recursion
  var creationFlags = Native.CreateProcessFlags.DEBUG_ONLY_THIS_PROCESS;
  Native.CreateProcess(null, commandLine, ref pSec, ref tSec,
                       true, (uint)creationFlags, IntPtr.Zero,
                       null, ref sInfo, out pInfo);

  // Our function that will collect information about the created process
  var info = QueryProcessInfo((uint)pInfo.dwProcessId, 0);

  // Passing information about the compiler to the server
  var client = new IpcClient();
  client.Start();
  client.SendMessage(info);
  client.Stop();

  // Finally launching the compiler process
  Native.DebugActiveProcessStop((uint)pInfo.dwProcessId);
  if (Native.WaitForSingleObject(pInfo.hProcess, Native.INFINITE)
      != Native.WAIT_OBJECT_0)
  {
    // Oops. The process ended in an unexpected way.
  }

  Native.GetExitCodeProcess(pInfo.hProcess, out var pExitCode);
  Native.CloseHandle(pInfo.hProcess);
  Native.CloseHandle(pInfo.hThread);

  return pExitCode;
}
How safe is this approach?
Since this mode requires editing the registry, you need to run the server with administrator privileges. This shouldn't come as a surprise.
The question arises: how do you restore the original state of the registry if the server stops unexpectedly for some reason?
CLMonitor, when running in the new mode, creates the 'wrapperBackup.reg' file on the '%AppData%/PVS-Studio' path. By opening this file with the registry editor, you can delete the keys added by the monitor or restore the original values of the fields that the monitor changed. Also, if the monitor detects this file at the launch, it will apply the file automatically.
The registry recovery file is checked before automatic restoration. CLMonitor will not use the file if it finds records that modify something other than IFEO keys.
Wrap Compilers mode can be run only on compiler executable files known to the analyzer. If there are unknown programs in the recovery file, the monitor will not use this file for automatic recovery.
Such measures are necessary because if an invalid program call is added to the 'Debugger' field, there are chances to break the launch of some processes. And it will be difficult to determine the reason why the compilation stopped working.
If the server is down and there are still IFEO entries to run the wrappers, the wrappers will simply continue executing the compiler processes passed to them.
Conclusion
The variety of development tools forces us to look for general approaches to work with them. This, in turn, leads to some other peculiarities and issues.
The compilation tracking mechanism is the most versatile way to gather the information the analyzer needs. The monitoring mode is now much more reliable.
If you have other ideas on how such a mechanism could be implemented (without writing a kernel-level driver), what other non-obviousnesses we have overlooked, etc., please, leave your comments bellow. We are open to suggestions.

Oldest comments (0)