VictoriaLogs: a Grafana dashboard for AWS VPC Flow Logs — migrating from Grafana Loki
In the previous post — AWS: VPC Flow Logs — logs to S3 and Grafana dashboard with Loki, we created a Grafana dashboard that displays NAT Gateway traffic usage statistics.
What we were interested in there was which Kubernetes Pods use the most bytes, because it directly affects our AWS Costs.
And everything appears to be fine with this board, except for one thing — Loki cannot process raw logs and build graphs in more than 30 minutes, maximum 1 hour, and even then, some of the visualizations do not load, although I tried to shade it — see Grafana Loki: performance optimization with Recording Rules, caching, and parallel queries.
So I decided to try the same approach — with S3 for VPC Flow Logs, Lambda, and Promtail — but with VictoriaLogs, especially since VictoriaLogs Grafana data source has already got better query support since version 0.8.0, and now you can build visualizations without Grafana Transformations.
So, what are we going to do?
- quickly show Terraform the code that creates S3 for VPC Flow Logs and AWS Lambda with Promtail, which sends data to VictoriaLogs
- create a new Grafana dashboard with VictoriaLogs datasource, and migrate queries from Loki and its LogQL to VictoriaLogs and LogsQL
Let me remind you from the previous post what we have in our setup:
- we know the CIDR of private subnets for Kubernetes Pods
— in my current project, we use only one network in the us-east-1a Availability Zone —
10.0.32.0/20 - we know the Elastic Network Interface ID of our NAT Gateway — we have one, so everything is simple here
- in the logs we have the
pkt_src_addrandpkt_dst_addrfields, by which we can select traffic only from/to Kubernetes Pods
Also worth checking out other posts on this topic:
- VictoriaLogs: an overview, run in Kubernetes, LogsQL, and Grafana
- AWS: VPC Flow Logs, NAT Gateways, and Kubernetes Pods — a detailed overview
- Grafana Loki: collecting AWS LoadBalancer logs from S3 with Promtail Lambda
- Loki: collecting logs from CloudWatch Logs using Lambda Promtail
- VictoriaMetrics: deploying a Kubernetes monitoring stack
Terraform
S3, and Promtail Lambda
I won’t go into detail here because the code seems to have enough comments describing each resource. This is just an example of how it can be done. In addition, the first version of the module was described in Terraform: creating a module for collecting AWS ALB logs in Grafana Loki, but here is a slightly modified version to be able to configure both Loki and VictoriaLogs, and not only ALB logs, but also VPC Flow Logs.
So, here’s how I implemented it:
- the
atlas-tf-modulesrepository : Terraform modules, which contains code for creating S3 buckets, Lambda, notifications and permissions - the
atlas-monitoringrepository: Terraform code and the Helm-chart of our monitoring, where the necessary resources are created - RDS, various additional S3 buckets, AWS ACM certificates, and the module fromatlas-tf-modules/alb-s3-logsis called to configure the collection of logs from S3 buckets
Let’s start with the alb-s3-logs module for S3 and Lambda. I wrote about Terraform and modules in Terraform: modules, Outputs, and Variables.
File structure in alb-s3-logs:
$ tree alb-s3-logs/
alb-s3-logs/
|-- README.md
|-- lambda.tf
|-- outputs.tf
|-- s3.tf
`-- variables.tf
Creating S3 buckets
The s3.tf file - creation of buckets:
# define S3 bucket names from parameters passed from a calling/root module in the 'atlas-monitoring' repository
locals {

  # ops-1-30-devops-ingress-ops-alb-loki-logs
  # "ops" "1-30" "devops" "ingress" "ops" "alb" "loki" "logs"
  # <aws_env>-<eks_version>-<component>-<application>-<app_env>-<aws_service>-<logger_type>-logs

  # ops-1-30-devops-vpc-ops-flow-loki-logs
  # "ops" "1-30" "devops" "vpc" "ops" "flow" "loki" "logs"
  # <aws_env>-<eks_version>-<component>-<application>-<app_env>-<aws_service>-<logger_type>-logs
  logs_bucket_names = { for env in var.app_environments : env => "${var.aws_env}-${var.eks_version}-${var.component}-${var.application}-${env}-${var.aws_service}-${var.logger_type}-logs" }
}

resource "aws_s3_bucket" "s3_logs" {
  for_each = local.logs_bucket_names

  bucket = each.value

  # to drop a bucket, set to `true` first
  # run `terraform apply`
  # then remove the block
  # and run `terraform apply` again
  force_destroy = true
}

# remove logs older than 30 days
resource "aws_s3_bucket_lifecycle_configuration" "bucket_config" {
  for_each = aws_s3_bucket.s3_logs

  bucket = each.value.id

  rule {
    id = "logs"
    status = "Enabled"

    expiration {
      days = 30
    }
  }
}

# block S3 bucket public access
resource "aws_s3_bucket_public_access_block" "s3_logs_backend_acl" {
  for_each = aws_s3_bucket.s3_logs

  bucket = each.value.id

  block_public_acls = true
  block_public_policy = true
  ignore_public_acls = true
  restrict_public_buckets = true
}

# using the 'var.aws_service == "alb"', attach the S3 bucket Policy to buckets for ALB Logs only
resource "aws_s3_bucket_policy" "s3_logs_alb" {
  for_each = {
    for key, bucket_name in aws_s3_bucket.s3_logs :
    key => bucket_name if var.aws_service == "alb"
  }

  bucket = each.value.id

  policy = jsonencode({
    Version = "2012-10-17"
    Statement = [
      {
        Sid = "RegionELBLogsWrite"
        Effect = "Allow"
        Principal = {
          AWS = "arn:aws:iam::${var.elb_account_id}:root"
        }
        Action = "s3:PutObject"
        Resource = "arn:aws:s3:::${each.value.id}/AWSLogs/${var.aws_account_id}/*"
      },
      {
        Sid = "PromtailLambdaLogsGet"
        Effect = "Allow"
        Principal = {
          AWS = module.logs_promtail_lambda[each.key].lambda_role_arn
        }
        Action = "s3:GetObject"
        Resource = "arn:aws:s3:::${each.value.id}/*"
      }
    ]
  })
}

# using the 'var.aws_service == "flow"', attach attach the S3 bucket Policy to buckets for VPC Flow Logs only
resource "aws_s3_bucket_policy" "s3_logs_flow" {
  for_each = {
    for key, bucket_name in aws_s3_bucket.s3_logs :
    key => bucket_name if var.aws_service == "flow"
  }

  bucket = each.value.id

  policy = jsonencode({
    Version = "2012-10-17"
    Statement = [
      {
        Sid = "VPCFlowLogsDeliveryWrite",
        Effect = "Allow",
        Principal = {
          Service = "delivery.logs.amazonaws.com"
        },
        Action = "s3:PutObject",
        Resource = "arn:aws:s3:::${each.value.id}/AWSLogs/${var.aws_account_id}/*",
        Condition = {
          StringEquals = {
            "aws:SourceAccount": "${var.aws_account_id}",
            "s3:x-amz-acl": "bucket-owner-full-control"
          },
          ArnLike = {
            "aws:SourceArn": "arn:aws:logs:us-east-1:${var.aws_account_id}:*"
          }
        }
      },
      {
        Sid = "VPCFlowLogsAclCheck",
        Effect = "Allow",
        Principal = {
          Service = "delivery.logs.amazonaws.com"
        },
        Action = "s3:GetBucketAcl",
        Resource = "arn:aws:s3:::${each.value.id}",
        Condition = {
          StringEquals = {
            "aws:SourceAccount": "${var.aws_account_id}"
          },
          ArnLike = {
            "aws:SourceArn": "arn:aws:logs:us-east-1:${var.aws_account_id}:*"
          }
        }
      },
      {
        Sid = "PromtailLambdaLogsGet"
        Effect = "Allow"
        Principal = {
          AWS = module.logs_promtail_lambda[each.key].lambda_role_arn
        }
        Action = "s3:GetObject"
        Resource = "arn:aws:s3:::${each.value.id}/*"
      }
    ]
  })
}

# send notifications to a Lambda function with Promtail when a new object is created in the S3 bucket
resource "aws_s3_bucket_notification" "s3_logs_lambda_notification" {
  for_each = aws_s3_bucket.s3_logs

  bucket = each.value.id

  lambda_function {
    lambda_function_arn = module.logs_promtail_lambda[each.key].lambda_function_arn
    events = ["s3:ObjectCreated:*"]
    filter_prefix = "AWSLogs/${var.aws_account_id}/"
  }
}
Creating Lambda functions with Promtail
The lambda.tf file:
# to allow network connections from S3 buckets IP range
data "aws_prefix_list" "s3" {
  filter {
    name = "prefix-list-name"
    values = ["com.amazonaws.us-east-1.s3"]
  }
}

# allow connections from S3 and from/to VPC Private Subnets to access Loki and VictoriaLogs
module "logs_security_group_lambda" {
  source = "terraform-aws-modules/security-group/aws"
  version = "~> 5.2.0"

  # 'ops-1-30-loki-lambda-sg'
  name = "${var.aws_env}-${var.eks_version}-lambda-${var.logger_type}-sg"
  description = "Security Group for Lambda Egress"

  vpc_id = var.vpc_id

  egress_cidr_blocks = var.vpc_private_subnets_cidrs
  egress_ipv6_cidr_blocks = []
  egress_prefix_list_ids = [data.aws_prefix_list.s3.id]

  ingress_cidr_blocks = var.vpc_private_subnets_cidrs
  ingress_ipv6_cidr_blocks = []

  egress_rules = ["https-443-tcp"]
  ingress_rules = ["https-443-tcp"]
}

# S3 buckets names:

  # ops-1-30-devops-ingress-ops-alb-loki-logs
  # "ops" "1-30" "devops" "ingress" "ops" "alb" "loki" "logs"
  # <aws_env>-<eks_version>-<component>-<application>-<app_env>-<aws_service>-<logger_type>-logs

  # ops-1-30-devops-vpc-ops-flow-loki-logs
  # "ops" "1-30" "devops" "vpc" "ops" "flow" "loki" "logs"
  # <aws_env>-<eks_version>-<component>-<application>-<app_env>-<aws_service>-<logger_type>-logs

module "logs_promtail_lambda" {
  source = "terraform-aws-modules/lambda/aws"
  version = "~> 7.16.0"
  # key: 'ops'
  # value: 'ops-1-30-devops-vpc-ops-flow-loki-logs'
  for_each = aws_s3_bucket.s3_logs

  # build Lambda function name like 'ops-1-30-devops-vpc-ops-flow-loki-logs-logger'
  function_name = "${each.value.id}-${var.logger_type}-logger"
  description = "Promtail instance to collect logs from S3"

  create_package = false
  # https://github.com/terraform-aws-modules/terraform-aws-lambda/issues/36
  publish = true

  # an error when sending logs from Flow Logs S3:
  # 'Task timed out after 3.05 seconds'
  timeout = 60

  image_uri = var.promtail_image
  package_type = "Image"
  architectures = ["x86_64"]

  # component=devops, logtype=alb, environment=ops, logger_type=loki
  # component=devops, logtype=flow, environment=ops, logger_type=loki
  environment_variables = {
    EXTRA_LABELS = "component,${var.component},logtype,${var.aws_service},environment,${each.key},logger_type,${var.logger_type}"
    KEEP_STREAM = "true"
    OMIT_EXTRA_LABELS_PREFIX = "true"
    PRINT_LOG_LINE = "true"
    WRITE_ADDRESS = var.logger_write_address
  }

  vpc_subnet_ids = var.vpc_private_subnets_ids
  vpc_security_group_ids = [module.logs_security_group_lambda.security_group_id]
  attach_network_policy = true

  # writing too many logs
  # see in CloudWatch Metrics by the 'IncomingBytes' metric
  # to save CloudWatch Logs costs, decrease the logs number
  # set to 'INFO' for debugging
  logging_application_log_level = "FATAL"
  logging_system_log_level = "WARN"
  logging_log_format = "JSON"

  # allow calling the Lambda from an S3 bucket
  # bucket name: ops-1-28-backend-api-dev-alb-logs
  allowed_triggers = {
    S3 = {
      principal = "s3.amazonaws.com"
      source_arn = "arn:aws:s3:::${each.value.id}"
    }
  }
}
Calling the atlas-tf-modules module from the monitoring code
Next, we describe the resources in the Terraform code in the atlas-monitoring repository - the logs.tf file.
Three resources are created here:
- a module for the Load Balancers Logs for Loki
- a module for the VPC Flow Logs for Loki
- a module for the VPC Flow Logs for VictoriaLogs
/*

Collect ALB Logs to Loki module

S3:

- will create an aws_s3_bucket for each app_environments[]:
  # bucket names:
  # '<eks_env>-<eks_version>-<component>-<application>-<app_env>-alb-logs'
  # i.e:
  # 'ops-1-28-backend-api-dev-alb-logs'
- will create an aws_s3_bucket_policy with Allow for each Lambda
- will create an aws_s3_bucket_notification with Push event on each s3:ObjectCreated to each Lambda

Lambda:

- will create a security_group_lambda with Allow 443 from VPC CIDR
- will create a Lambda with Promtail for each aws_s3_bucket

*/

module "vpc_flow_logs_loki" {
  # create the module for each EKS cluster by its version
  # for_each = var.eks_versions
  for_each = toset(["1-30"])
  source = "git@github.com:ORG-NAME/atlas-tf-modules//alb-s3-logs?ref=master"
  # for local development
  # source = "/home/setevoy/Work/atlas-tf-modules//alb-s3-logs"

  # ops-1-30-devops-ingress-ops-alb-loki-logs
  # "ops" "1-30" "devops" "ingress" "ops" "alb" "loki" "logs"
  # <aws_env>-<eks_version>-<component>-<application>-<app_env>-<aws_service>-<logger_type>-logs

  # ops-1-30-devops-vpc-ops-flow-loki-logs
  # "ops" "1-30" "devops" "vpc" "ops" "flow" "loki" "logs"
  # <aws_env>-<eks_version>-<component>-<application>-<app_env>-<aws_service>-<logger_type>-logs

  # 'ops'
  aws_env = var.aws_environment
  # '1-30'
  eks_version = each.value
  # by team: 'backend', 'devops'
  component = "devops"
  application = "vpc"
  app_environments = ["ops"]
  aws_service = "flow"
  logger_type = "loki"

  vpc_id = local.vpc_out.vpc_id
  vpc_private_subnets_cidrs = local.vpc_out.vpc_private_subnets_cidrs
  vpc_private_subnets_ids = local.vpc_out.vpc_private_subnets_ids
  # 'https://loki.monitoring.1-30.ops.example.co:443/loki/api/v1/push'
  logger_write_address = "https://loki.monitoring.${each.value}.ops.example.com:443/loki/api/v1/push"
  aws_account_id = data.aws_caller_identity.current.account_id
}

module "vpc_flow_logs_vmlogs" {
  # create the module for each EKS cluster by its version
  # for_each = var.eks_versions
  for_each = toset(["1-30"])
  source = "git@github.com:ORG-NAME/atlas-tf-modules//alb-s3-logs?ref=master"
  # for local development
  # source = "/home/setevoy/Work/atlas-tf-modules//alb-s3-logs"

  # ops-1-30-devops-ingress-ops-alb-loki-logs
  # "ops" "1-30" "devops" "ingress" "ops" "alb" "loki" "logs"
  # <aws_env>-<eks_version>-<component>-<application>-<app_env>-<aws_service>-<logger_type>-logs

  # ops-1-30-devops-vpc-ops-flow-loki-logs
  # "ops" "1-30" "devops" "vpc" "ops" "flow" "loki" "logs"
  # <aws_env>-<eks_version>-<component>-<application>-<app_env>-<aws_service>-<logger_type>-logs

  # 'ops'
  aws_env = var.aws_environment
  # '1-30'
  eks_version = each.value
  # by team: 'backend', 'devops'
  component = "devops"
  application = "vpc"
  app_environments = ["ops"]
  aws_service = "flow"
  logger_type = "vmlogs"

  vpc_id = local.vpc_out.vpc_id
  vpc_private_subnets_cidrs = local.vpc_out.vpc_private_subnets_cidrs
  vpc_private_subnets_ids = local.vpc_out.vpc_private_subnets_ids
  # create log streams by the 'logtype,environment,logger_type' fields
  # see https://docs.victoriametrics.com/victorialogs/keyconcepts/#stream-fields
  logger_write_address = "https://vmlogs.monitoring.${each.value}.ops.example.com:443/insert/loki/api/v1/push?_stream_fields=logtype,environment,logger_type"
  aws_account_id = data.aws_caller_identity.current.account_id
}

# ../../atlas-load-balancers/helm/templates/external-ingress-alb.yaml:
# alb.ingress.kubernetes.io/load-balancer-attributes: access_logs.s3.enabled=true,access_logs.s3.bucket=ops-1-30-devops-ingress-ops-alb-logs
# two ALB are using this buckets for their logs - the External, 'ops-external-ingress', and the Internal one, 'ops-internal-ingress'
# both are in the 'ops-common-alb-ns' Namespace
module "single_ingress_alb_logs_loki" {
  # create the module for each EKS cluster by its version
  # for_each = var.eks_versions
  for_each = toset(["1-30"])
  source = "git@github.com:ORG-NAME/atlas-tf-modules//alb-s3-logs?ref=master"
  # for local development
  # source = "/home/setevoy/Work/atlas-tf-modules//alb-s3-logs"

  # ops-1-30-devops-ingress-ops-alb-loki-logs
  # "ops" "1-30" "devops" "ingress" "ops" "alb" "loki" "logs"
  # <aws_env>-<eks_version>-<component>-<application>-<app_env>-<aws_service>-<logger_type>-logs

  # ops-1-30-devops-vpc-ops-flow-loki-logs
  # "ops" "1-30" "devops" "vpc" "ops" "flow" "loki" "logs"
  # <aws_env>-<eks_version>-<component>-<application>-<app_env>-<aws_service>-<logger_type>-logs

  # 'ops'
  aws_env = var.aws_environment
  # '1-30'
  eks_version = each.value
  component = "devops"
  application = "ingress"
  app_environments = ["ops"]
  aws_service = "alb"
  logger_type = "loki"

  vpc_id = local.vpc_out.vpc_id
  vpc_private_subnets_cidrs = local.vpc_out.vpc_private_subnets_cidrs
  vpc_private_subnets_ids = local.vpc_out.vpc_private_subnets_ids
  # 'https://loki.monitoring.1-30.ops.example.co:443/loki/api/v1/push'
  logger_write_address = "https://loki.monitoring.${each.value}.ops.example.com:443/loki/api/v1/push"
  aws_account_id = data.aws_caller_identity.current.account_id
}
That’s all there is to it.
A VPC Flow Logs module
The terraform-aws-modules/vpc/aws module has support for the VPC Flow Logs, but you can only set one flow_log_destination_arn, in which I currently have Grafana Loki - the ops-1-30-devops-vpc-ops-flow-loki-logs S3 bucket:
module "vpc" {
  source = "terraform-aws-modules/vpc/aws"
  version = "~> 5.16.0"

  ...

  enable_flow_log = var.vpc_params.enable_flow_log

  # Default: "cloud-watch-logs"
  flow_log_destination_type = "s3"

  # disalbe to use S3
  create_flow_log_cloudwatch_log_group = false
  create_flow_log_cloudwatch_iam_role = false

  # ARN of the CloudWatch log group or S3 bucket
  # disable if use 'create_flow_log_cloudwatch_log_group' and the default 'flow_log_destination_type' value (cloud-watch-logs)
  flow_log_destination_arn = "arn:aws:s3:::ops-1-30-devops-vpc-ops-flow-loki-logs"

  flow_log_cloudwatch_log_group_name_prefix = "/aws/${local.env_name}-flow-logs/"
  flow_log_log_format = "$${region} $${vpc-id} $${az-id} $${subnet-id} $${instance-id} $${interface-id} $${flow-direction} $${srcaddr} $${dstaddr} $${srcport} $${dstport} $${pkt-srcaddr} $${pkt-dstaddr} $${pkt-src-aws-service} $${pkt-dst-aws-service} $${traffic-path} $${packets} $${bytes} $${action}"

  vpc_flow_log_tags = {
    "Name" = "flow-logs-s3-to-loki"
  }
}
To write to two S3 buckets at once, just add another aws_flow_log resource.
VPC Flow Logs are written in a custom format:
resource "aws_flow_log" "vpc_flow_vmlogs" {
  vpc_id = module.vpc.vpc_id
  log_destination = "arn:aws:s3:::ops-1-30-devops-vpc-ops-flow-vmlogs-logs"
  log_destination_type = "s3"
  traffic_type = "ALL"
  log_format = "$${region} $${vpc-id} $${az-id} $${subnet-id} $${instance-id} $${interface-id} $${flow-direction} $${srcaddr} $${dstaddr} $${srcport} $${dstport} $${pkt-srcaddr} $${pkt-dstaddr} $${pkt-src-aws-service} $${pkt-dst-aws-service} $${traffic-path} $${packets} $${bytes} $${action}"
  tags = {
    "Name" = "flow-logs-s3-to-vmlogs"
  }
}
In addition, I manually created Flow Logs with a destination to the CloudWatch Logs to validate query results in the Loki and VictoriaLogs.
Creating a Grafana dashboard
NAT Gateway Total processed
First, we display general statistics on how much traffic passed through the NAT Gateway — both from Kubernetes Pods to the Internet, and from the Internet to Kubernetes Pods.
A Loki query
In the Loki, the request looks like this:
sum (
    sum_over_time(
        ({logtype="flow", logger_type="loki"} | pattern `<region> <vpc_id> <az_id> <subnet_id> <instance_id> <interface_id> <flow_direction> <src_add> <dst_addr> <src_port> <dst_port> <pkt_src_addr> <pkt_dst_addr> <pkt_src_aws_service> <pkt_dst_aws_service> <traffic_path> <packets> <bytes> <action>`
        | interface_id="eni-0352f8c82da6aa229"
        | pkt_src_addr=ip("10.0.32.0/20") OR pkt_dst_addr=ip("10.0.32.0/20")
        | pkt_src_addr=~"${kubernetes_pod_ip}"
        | pkt_dst_addr=~"${remote_svc_ip}"
        | unwrap bytes
        | __error__ =""
        )[$__range]
    )
)
Here:
- calculate
sum_over_time()for the period selected in the Grafana dashboard -$__range - count the traffic either from Kubernetes Pods —
pkt_src_addr=ip("10.0.32.0/20"), or vice versa to Kubernetes Pods -pkt_dst_addr=ip("10.0.32.0/20") - count by the
bytesfield -unwrap bytes
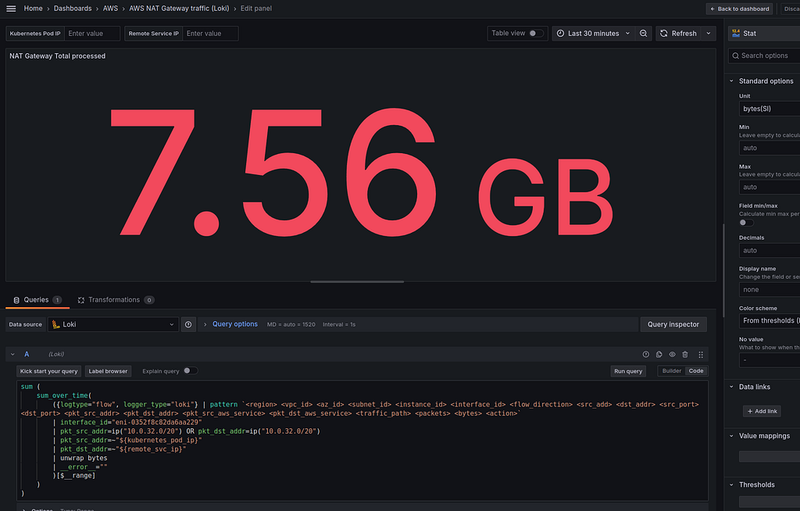
With this query, we have the following data:
kubernetes_pod_ip and remote_svc_ip are variables in the Grafana dashboard to be able to check data for specific addresses:
A VictoriaLogs query
Now, we need to translate this query into LogsQL format for VictoriaLogs.
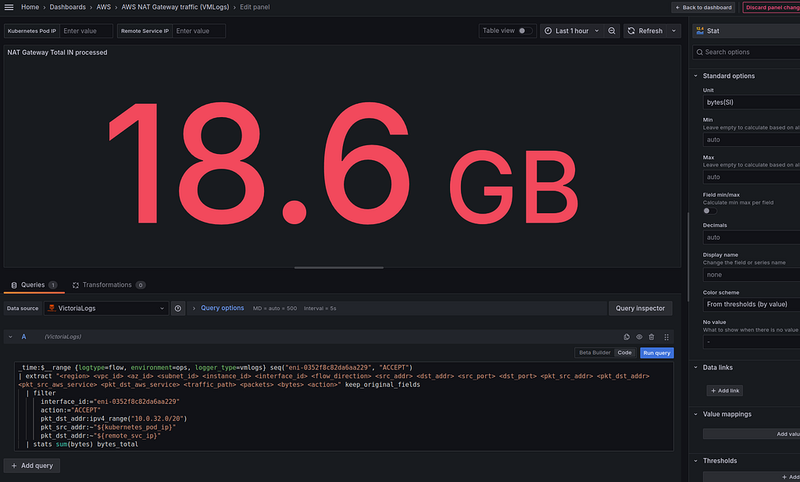
It will look like this:
_time:$__range {logtype=flow, environment=ops, logger_type=vmlogs} seq("eni-0352f8c82da6aa229", "ACCEPT")
| extract "<region> <vpc_id> <az_id> <subnet_id> <instance_id> <interface_id> <flow_direction> <src_addr> <dst_addr> <src_port> <dst_port> <pkt_src_addr> <pkt_dst_addr> <pkt_src_aws_service> <pkt_dst_aws_service> <traffic_path> <packets> <bytes> <action>"
  | filter
      interface_id:="eni-0352f8c82da6aa229"
      action:="ACCEPT"
      (pkt_src_addr:ipv4_range("10.0.32.0/20") OR pkt_dst_addr:ipv4_range("10.0.32.0/20"))
      pkt_src_addr:~"${kubernetes_pod_ip}"
      pkt_dst_addr:~"${remote_svc_ip}"
  | stats sum(bytes) bytes_total
Support for the Grafana $__range variable was introduced only recently in the VictoriaLogs datasource version 0.9.0, so update yourself.
Here we are:
- select data for
_time:$__range - in the
{logtype=flow, environment=ops, logger_type=vmlogs}we use the log stream selector with labels that are set in Lambda Promtail when writing logs -/insert/loki/api/v1/push?_stream_fields=logtype,environment,logger_type - the
seq("eni-0352f8c82da6aa229", "ACCEPT")- use the Sequence filter to select only records from the NAT Gateway interface andACCEPTto speed up the query execution (see the comment from Olexandr Valialkin here>>>) - with the
extractwe form fields from log entries - with the
filterwe select the NAT Gateway interface,ACCEPT, and as in the Loki request - filter traffic either from Kubernetes Pods with IPv4 range filter -pkt_src_addr:ipv4_range("10.0.32.0/20"), or vice versa to Kubernetes Pods -pkt_dst_addr:ipv4_range("10.0.32.0/20")(note that theORcondition are enclosed in brackets) - and at the end with the
statswe calculate the sum of the bytes field, and write the result in thebytes_totalfield
Verification with CloudWatch Logs Insights
To be able to check the data in Loki and VictoriaLogs, VPC now also writes to CloudWatch Logs.
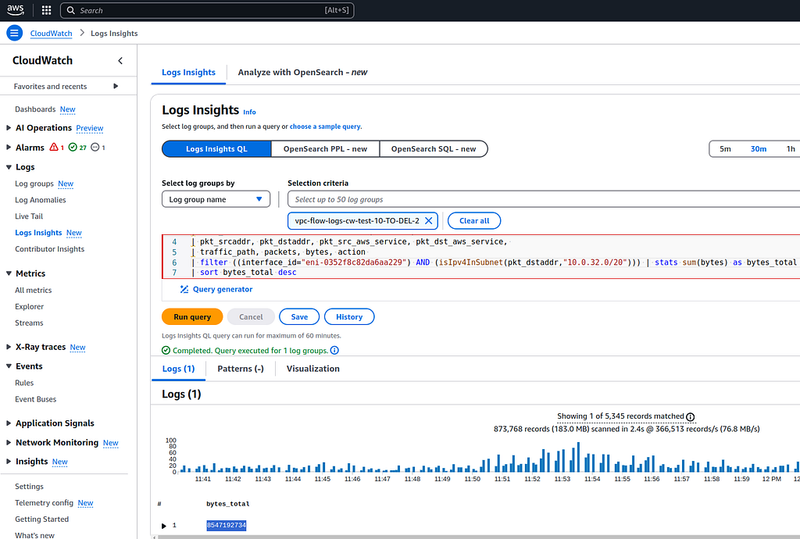
Let’s make such a query in the Logs Insights:
parse @message "* * * * * * * * * * * * * * * * * * *"
| as region, vpc_id, az_id, subnet_id, instance_id, interface_id,
| flow_direction, srcaddr, dstaddr, srcport, dstport,
| pkt_srcaddr, pkt_dstaddr, pkt_src_aws_service, pkt_dst_aws_service,
| traffic_path, packets, bytes, action
| filter ((interface_id="eni-0352f8c82da6aa229") AND ((isIpv4InSubnet(pkt_srcaddr,"10.0.32.0/20") OR isIpv4InSubnet(pkt_dstaddr,"10.0.32.0/20") )) | stats sum(bytes) as bytes_total
As a result, we have 8547192734 bytes:
That in SI format (see Binary prefixes) gives us 1.87 gigabytes — let’s calculate with a calculator:
$ bc
scale=2
8547192734/1000/1000/1000
8.54
In the Loki we had 7.56 GiB, and in the VictoriaLogs — 8.66 GiB.
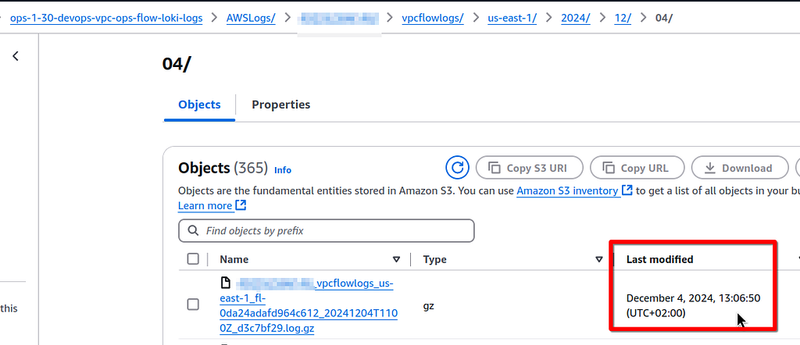
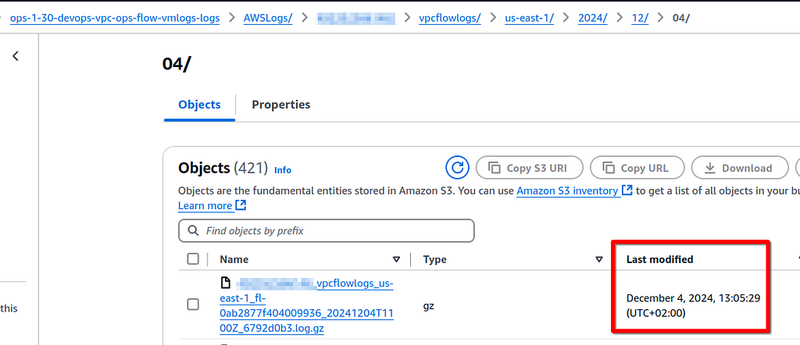
There can differ a bit in the Loki, VictoriaLogs, and CloudWatch results, especially when sampling for only 30 minutes, because Flow Logs themselves are written with a difference of several minutes.
For example, in the Loki bucket, the last object was created at 13:06:50:
But in the VMLogs bucket — in the 13:05:29:
Validating with the Cost Explorer
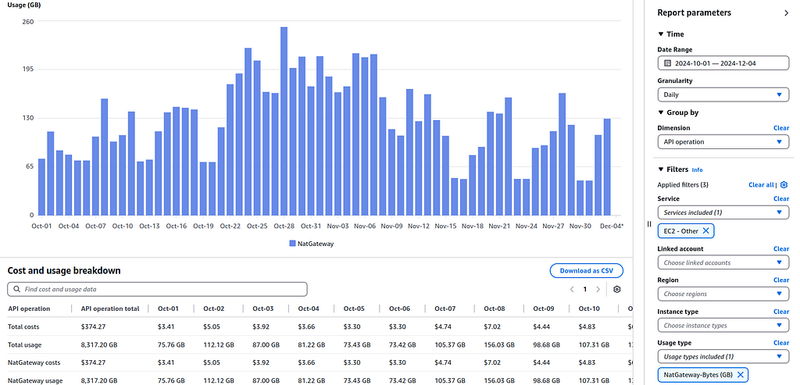
You can also check the data usage with the Cost Explorer.
Select the Service == EC2-Other, and Usage type == NatGateway-Bytes (GB):
Over the past day, we have 129 gigabytes of traffic processed by the NAT Gateway.
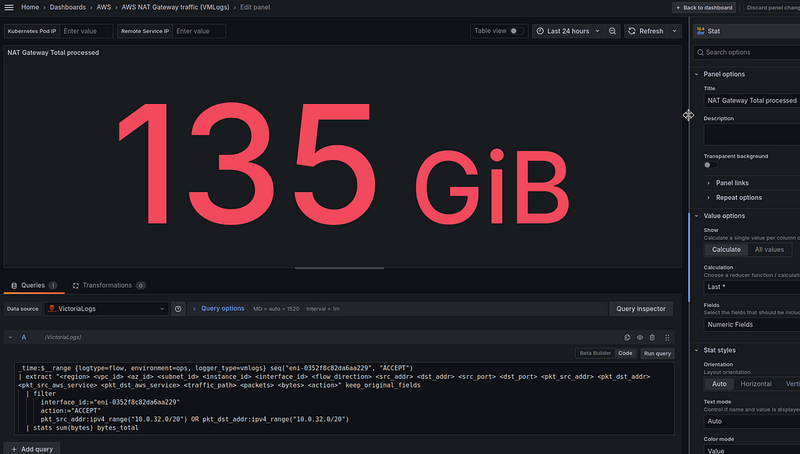
If we make a range of 24 hours in Grafana (we can finally do this because we now have VictoriaLogs), we will see 135 gigabytes in the “NAT Gateway Total processed” panel:
Plus or minus it’s the same, because Cost Explorer doesn’t count the last 24 hours like Grafana, but the previous day, and it uses UTC (+00:00) time zone.
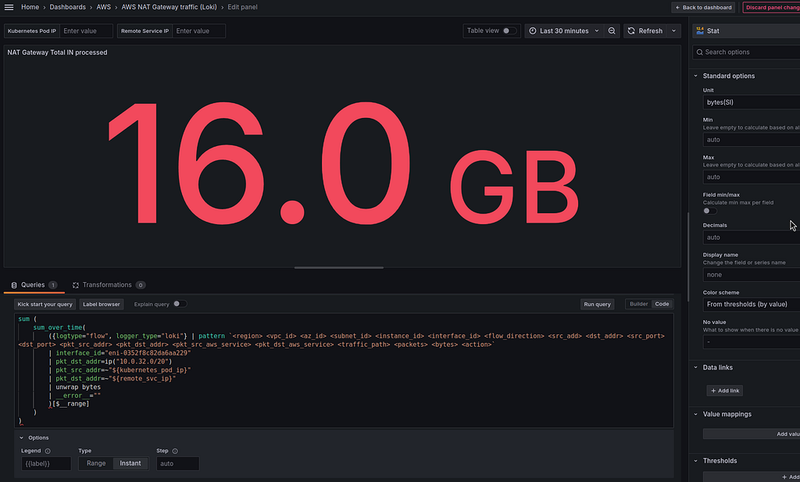
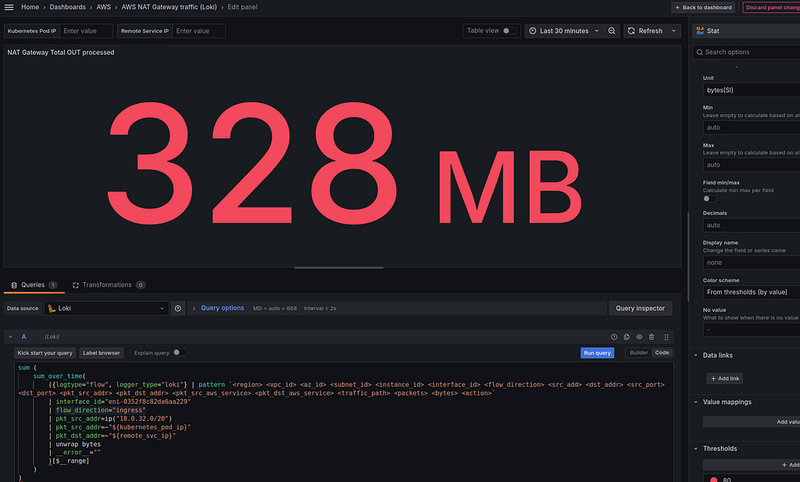
NAT Gateway Total OUT and IN processed
Next, we want to see the direction of the traffic — from Kubernetes Pods to the Internet, and from the Internet to Kubernetes Pods.
Let’s recall what we have in the records for packets passing through the NAT Gateway — as we analyzed in the Traffic from the Pod to the External Server through the NAT Gateway, and VPC Flow Logs:
- by the
interface_idfield, we filter only those records that were made from the NAT Gateway interface - if the packet goes from a Kubernetes Pod to the Internet, then the
pkt_src_addrfield will contain the IP of this Pod - if the packet goes from the Internet to a Kubernetes Pod, then the
pkt_dst_addrfield will contain the IP of this Pod
Loki queries
Therefore, to count bytes from the Internet to Kubernetes Pods we can make the following query in Loki: with sum_over_time() and $__range to select data for 30 minutes, and the pkt_dst_addr=ip("10.0.32.0/20 ") to select IPs only from the VPC Private Subnet used for Kubernetes Pods:
sum (
    sum_over_time(
        ({logtype="flow", logger_type="loki"} | pattern `<region> <vpc_id> <az_id> <subnet_id> <instance_id> <interface_id> <flow_direction> <src_add> <dst_addr> <src_port> <dst_port> <pkt_src_addr> <pkt_dst_addr> <pkt_src_aws_service> <pkt_dst_aws_service> <traffic_path> <packets> <bytes> <action>`
        | interface_id="eni-0352f8c82da6aa229"
        | pkt_dst_addr=ip("10.0.32.0/20")
        | pkt_src_addr=~"${kubernetes_pod_ip}"
        | pkt_dst_addr=~"${remote_svc_ip}"
        | unwrap bytes
        | __error__ =""
        )[$__range]
    )
)
To accelerate the request process, you can set Type == Instant at the bottom of the Options.
And similarly, but we count from Kubernetes Pods to the Internet:
sum (
    sum_over_time(
        ({logtype="flow", logger_type="loki"} | pattern `<region> <vpc_id> <az_id> <subnet_id> <instance_id> <interface_id> <flow_direction> <src_add> <dst_addr> <src_port> <dst_port> <pkt_src_addr> <pkt_dst_addr> <pkt_src_aws_service> <pkt_dst_aws_service> <traffic_path> <packets> <bytes> <action>`
        | interface_id="eni-0352f8c82da6aa229"
        | flow_direction="ingress"
        | pkt_src_addr=ip("10.0.32.0/20")
        | pkt_src_addr=~"${kubernetes_pod_ip}"
        | pkt_dst_addr=~"${remote_svc_ip}"
        | unwrap bytes
        | __error__ =""
        )[$__range]
    )
)
VictoriaLogs queries
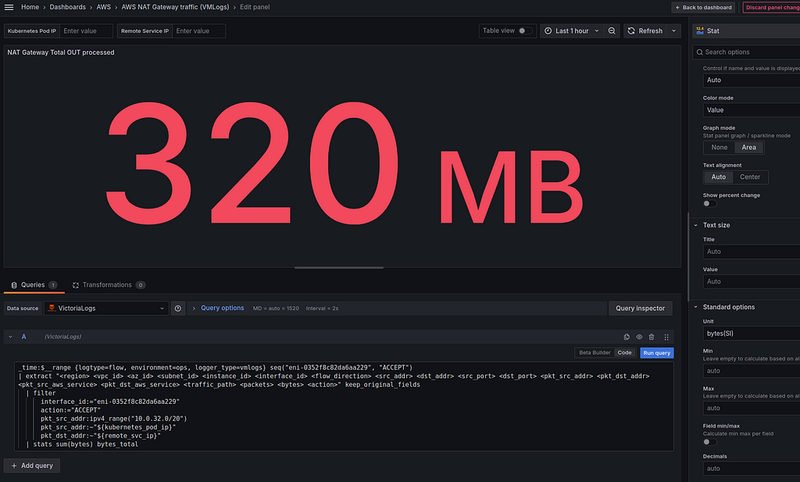
Queries for VictoriaLogs will look like this: from the Internet to Kubernetes Pods:
_time:$__range {logtype=flow, environment=ops, logger_type=vmlogs} seq("eni-0352f8c82da6aa229", "ACCEPT")
| extract "<region> <vpc_id> <az_id> <subnet_id> <instance_id> <interface_id> <flow_direction> <src_addr> <dst_addr> <src_port> <dst_port> <pkt_src_addr> <pkt_dst_addr> <pkt_src_aws_service> <pkt_dst_aws_service> <traffic_path> <packets> <bytes> <action>"
  | filter
      interface_id:="eni-0352f8c82da6aa229"
      action:="ACCEPT"
      pkt_dst_addr:ipv4_range("10.0.32.0/20")
      pkt_src_addr:~"${kubernetes_pod_ip}"
      pkt_dst_addr:~"${remote_svc_ip}"
  | stats sum(bytes) bytes_total
From Kubernetes Pods to the Internet:
_time:$__range {logtype=flow, environment=ops, logger_type=vmlogs} seq("eni-0352f8c82da6aa229", "ACCEPT")
| extract "<region> <vpc_id> <az_id> <subnet_id> <instance_id> <interface_id> <flow_direction> <src_addr> <dst_addr> <src_port> <dst_port> <pkt_src_addr> <pkt_dst_addr> <pkt_src_aws_service> <pkt_dst_aws_service> <traffic_path> <packets> <bytes> <action>"
  | filter
      interface_id:="eni-0352f8c82da6aa229"
      action:="ACCEPT"
      pkt_src_addr:ipv4_range("10.0.32.0/20")
      pkt_src_addr:~"${kubernetes_pod_ip}"
      pkt_dst_addr:~"${remote_svc_ip}"
  | stats sum(bytes) bytes_total
And all three panels together:
NAT Gateway Total processed bytes/sec
In addition to the Stat panels, I would like to see a historical picture of how traffic has changed over the time.
Loki query
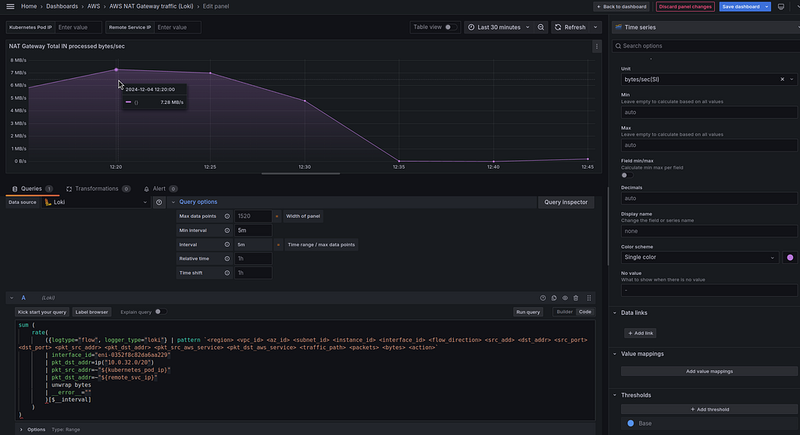
In Loki, everything is simple — we just use the rate() function:
sum (
    rate(
        ({logtype="flow", logger_type="loki"} | pattern `<region> <vpc_id> <az_id> <subnet_id> <instance_id> <interface_id> <flow_direction> <src_add> <dst_addr> <src_port> <dst_port> <pkt_src_addr> <pkt_dst_addr> <pkt_src_aws_service> <pkt_dst_aws_service> <traffic_path> <packets> <bytes> <action>`
        | interface_id="eni-0352f8c82da6aa229"
        | pkt_dst_addr=ip("10.0.32.0/20")
        | pkt_src_addr=~"${kubernetes_pod_ip}"
        | pkt_dst_addr=~"${remote_svc_ip}"
        | unwrap bytes
        | __error__ =""
        )[$__interval]
    )
)
In the Options and in the rate() we use an interval of 5 minutes, in Standard Options > Unit set "bytes/sec(SI)", and as a result we have 7.25 MB/s at 12:20:
VictoriaLogs query
With the VictoriaLogs it’s a bit more interesting because VictoriaLogs doesn’t have yet a rate() function out of the box (but developers promise to add it soon).
Also, there is one more nuance:
- Loki counts data “backwards”, that is, the point on the graph is at 12:25 and
rate()takes the previous 5 minutes -[5m]from the Options which is passed in$__interval - in VictoriaLogs, the graph will be displayed at the time of the request execution
To calculate the per-second rate of our bytes, we can use the math pipe.
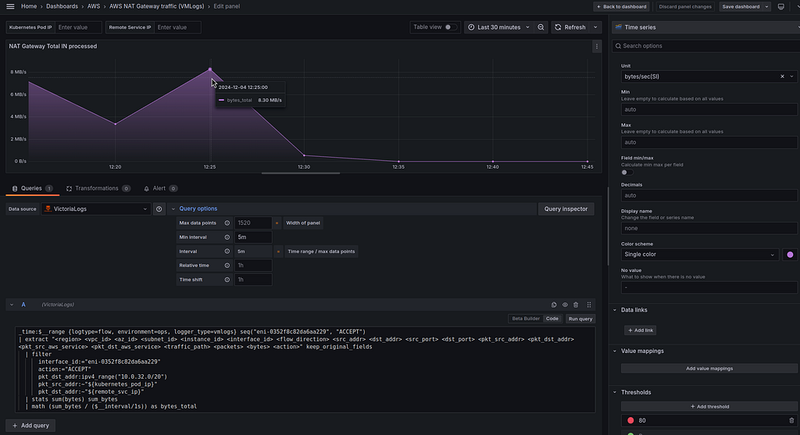
So, the query will be as follows:
_time:$__range {logtype=flow, environment=ops, logger_type=vmlogs} seq("eni-0352f8c82da6aa229", "ACCEPT")
| extract "<region> <vpc_id> <az_id> <subnet_id> <instance_id> <interface_id> <flow_direction> <src_addr> <dst_addr> <src_port> <dst_port> <pkt_src_addr> <pkt_dst_addr> <pkt_src_aws_service> <pkt_dst_aws_service> <traffic_path> <packets> <bytes> <action>"
  | filter
      interface_id:="eni-0352f8c82da6aa229"
      action:="ACCEPT"
      pkt_dst_addr:ipv4_range("10.0.32.0/20")
      pkt_src_addr:~"${kubernetes_pod_ip}"
      pkt_dst_addr:~"${remote_svc_ip}"
  | stats sum(bytes) sum_bytes
  | math (sum_bytes / ($__interval/1s)) as bytes_total
Here:
- in the
stats sum(bytes)we calculate the sum of bytes for the interval specified in Options (5 minutes), the result is saved assum_bytes - then we use
mathto calculate the sum of bytes from thesum_bytesfor each interval on the graph, and divide them by the number of seconds in the selected$__interval
Here we have 8.30 MB/s at 12:20. It appears to be similar to the Loki’s result. You can go all out with the checking and calculate it manually from the logs, but super accurate numbers are not critical here, we are just interested in the total trend, so for me, it’s OK.
In general, when building graphs, you don’t need to write _time:$__range, because it is done in VMLogs itself "under the hood", but I'm adding it for clarity.
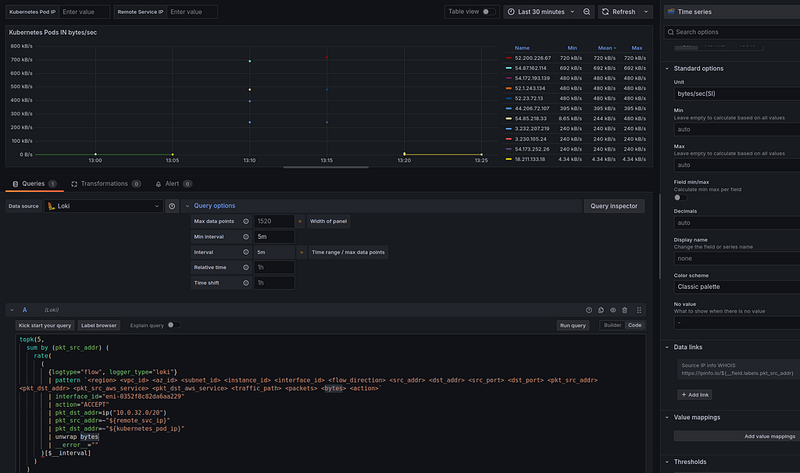
Kubernetes Pods IN From IP
Next, let’s display the top Kubernetes Pods IPs by traffic received from the Internet.
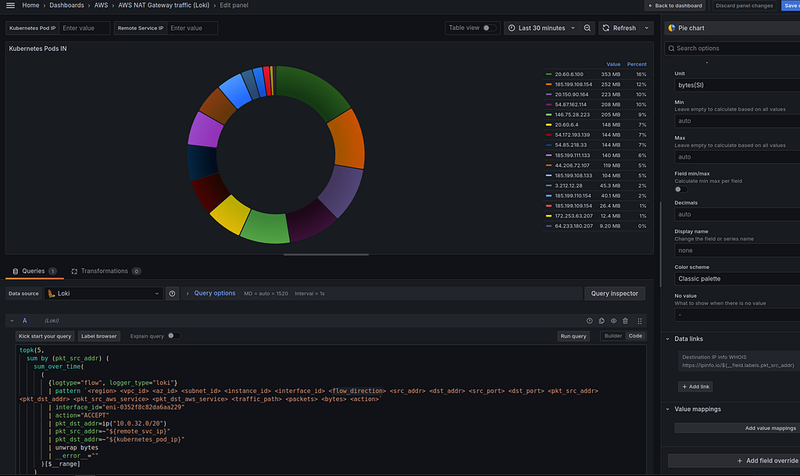
Loki query
For Loki, we use the sum_over_time() for the $__range, in our dashboard it is 30 minutes:
topk(5,
  sum by (pkt_src_addr) (
    sum_over_time(
      (
        {logtype="flow", logger_type="loki"}
        | pattern `<region> <vpc_id> <az_id> <subnet_id> <instance_id> <interface_id> <flow_direction> <src_addr> <dst_addr> <src_port> <dst_port> <pkt_src_addr> <pkt_dst_addr> <pkt_src_aws_service> <pkt_dst_aws_service> <traffic_path> <packets> <bytes> <action>`
        | interface_id="eni-0352f8c82da6aa229"
        | action="ACCEPT"
        | pkt_dst_addr=ip("10.0.32.0/20")
        | pkt_src_addr=~"${remote_svc_ip}"
        | pkt_dst_addr=~"${kubernetes_pod_ip}"
        | unwrap bytes
        | __error__ =""
      )[$__range]
    )
  )
)
See the Grafana Data links — very useful feature in Grafana.
VictoriaLogs query
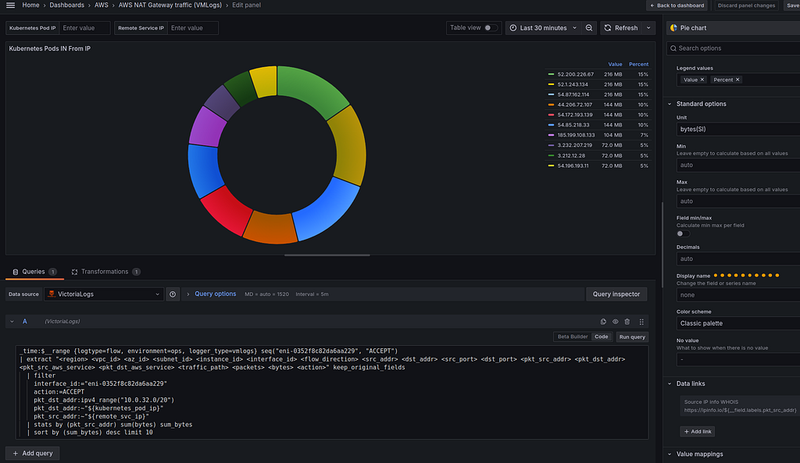
And a similar query for VictoriaLogs will look like this:
_time:$__range {logtype=flow, environment=ops, logger_type=vmlogs} seq("eni-0352f8c82da6aa229", "ACCEPT")
| extract "<region> <vpc_id> <az_id> <subnet_id> <instance_id> <interface_id> <flow_direction> <src_addr> <dst_addr> <src_port> <dst_port> <pkt_src_addr> <pkt_dst_addr> <pkt_src_aws_service> <pkt_dst_aws_service> <traffic_path> <packets> <bytes> <action>"
  | filter
    interface_id:="eni-0352f8c82da6aa229"
    action:=ACCEPT
    pkt_dst_addr:ipv4_range("10.0.32.0/20")
    pkt_dst_addr:~"${kubernetes_pod_ip}"
    pkt_src_addr:~"${remote_svc_ip}"
  | stats by (pkt_src_addr) sum(bytes) sum_bytes
  | sort by (sum_bytes) desc limit 10
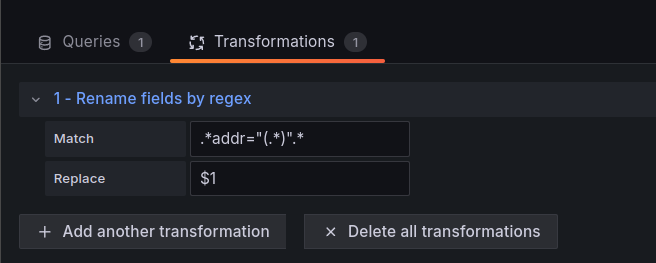
VictoriaLogs does not yet support Options for Legend and returns the result directly to JSON.
Therefore, to make everything beautiful and without any unnecessary data, we can add Transformations > “Rename fields by regex”, in which we will “cut” only IP addresses with the regular expression .*addr="(.*)".*:
And what do we have here:
- in the Loki, we have in the top an 20.150.90.164 IP with 954 MB
- in the VictoriaLogs, we have the same 20.150.90.164 IP with 954 MB is in the top
In general, the data is similar, although the sorting is slightly different in Loki, again due to a slight delay. And topk() in Loki works a bit weird. I tried to dig into this once, but gave up. In VictoriaLogs, limit works better (although there is also a bug, we'll see later).
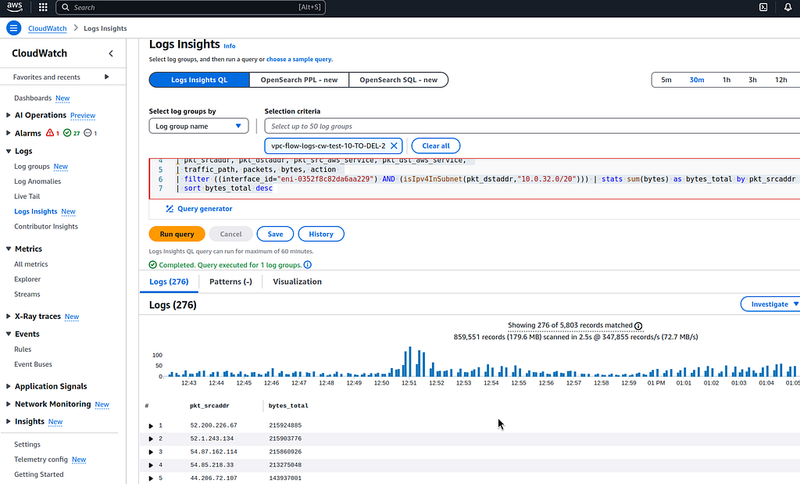
Let’s check the 20.150.90.164 IP in the CloudWatch Logs Insights with the following query:
parse @message "* * * * * * * * * * * * * * * * * * *"
| as region, vpc_id, az_id, subnet_id, instance_id, interface_id,
| flow_direction, srcaddr, dstaddr, srcport, dstport,
| pkt_srcaddr, pkt_dstaddr, pkt_src_aws_service, pkt_dst_aws_service,
| traffic_path, packets, bytes, action
| filter ((interface_id="eni-0352f8c82da6aa229") AND (isIpv4InSubnet(pkt_dstaddr,"10.0.32.0/20"))) | stats sum(bytes) as bytes_total by pkt_srcaddr
| sort bytes_total desc
The data in VictoriaLogs is more similar to the truth, but in general, both systems display the data more or less correctly.
Again, if we take a longer period of time (which we can’t do with Loki, but we can with VictoriaLogs), the data in CloudWatch Logs and VictoriaLogs will be even more accurate.
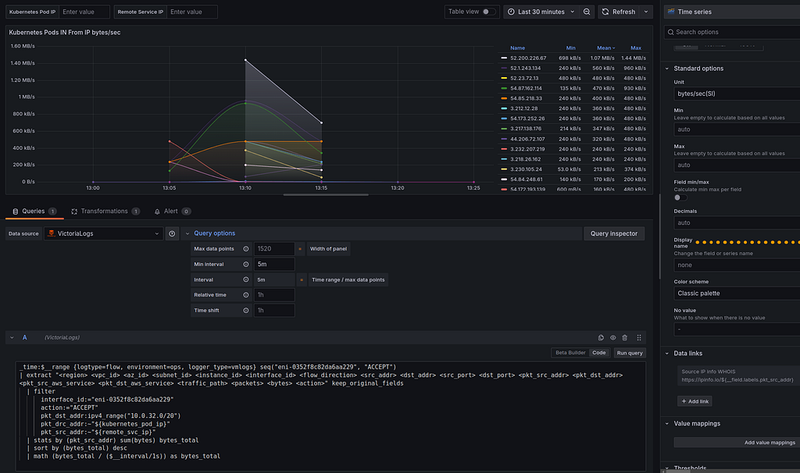
Kubernetes Pods IN From IP bytes/sec
It’s the same as we did for the “NAT Gateway Total IN processed” panel — to get a historical picture of traffic.
Loki query
topk(5,
  sum by (pkt_src_addr) (
    rate(
      (
        {logtype="flow", logger_type="loki"}
        | pattern `<region> <vpc_id> <az_id> <subnet_id> <instance_id> <interface_id> <flow_direction> <src_addr> <dst_addr> <src_port> <dst_port> <pkt_src_addr> <pkt_dst_addr> <pkt_src_aws_service> <pkt_dst_aws_service> <traffic_path> <packets> <bytes> <action>`
        | interface_id="eni-0352f8c82da6aa229"
        | action="ACCEPT"
        | pkt_dst_addr=ip("10.0.32.0/20")
        | pkt_src_addr=~"${remote_svc_ip}"
        | pkt_dst_addr=~"${kubernetes_pod_ip}"
        | unwrap bytes
        | __error__ =""
      )[$__interval]
    )
  )
)
VictoriaLogs query
_time:$__range {logtype=flow, environment=ops, logger_type=vmlogs} seq("eni-0352f8c82da6aa229", "ACCEPT")
| extract "<region> <vpc_id> <az_id> <subnet_id> <instance_id> <interface_id> <flow_direction> <src_addr> <dst_addr> <src_port> <dst_port> <pkt_src_addr> <pkt_dst_addr> <pkt_src_aws_service> <pkt_dst_aws_service> <traffic_path> <packets> <bytes> <action>"
  | filter
      interface_id:="eni-0352f8c82da6aa229"
      action:="ACCEPT"
      pkt_dst_addr:ipv4_range("10.0.32.0/20")
      pkt_drc_addr:~"${kubernetes_pod_ip}"
      pkt_src_addr:~"${remote_svc_ip}"
  | stats by (pkt_src_addr) sum(bytes) bytes_total
  | sort by (bytes_total) desc
  | math (bytes_total / ($__interval/1s)) as bytes_total
The data is also similar.
But here again, there is a problem with topk() in Loki - the limit is set to the top 5 results, but Loki displays 11.
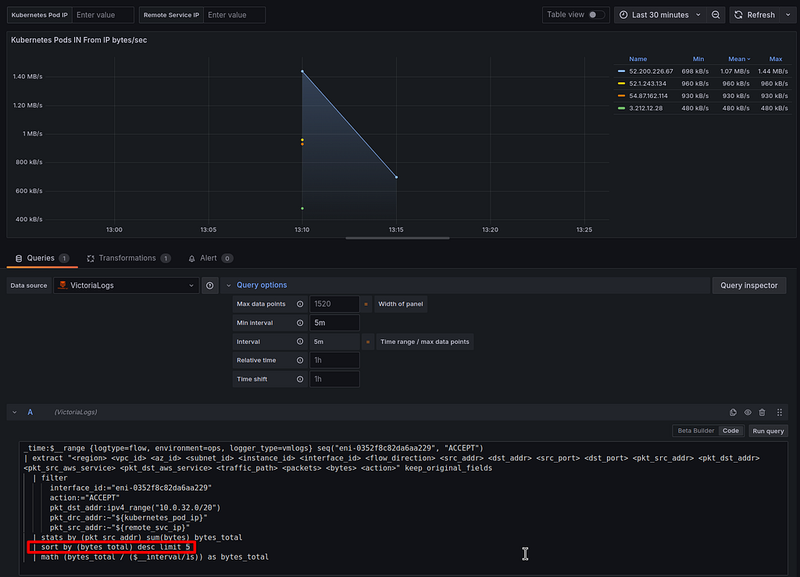
VictoriaLogs also has a problem with limit, for example, set | sort by (bytes_total) desc limit 5:
As a result, we have not the top 5 IPs, but just 5 points on the chart.
I talked to the VictoriaMetrics developers — they say it looks like a bug, so I opened a GitHub Issue for them, and we’ll see what happens in the next releases with bugfixes.
UPD : this was already fixed
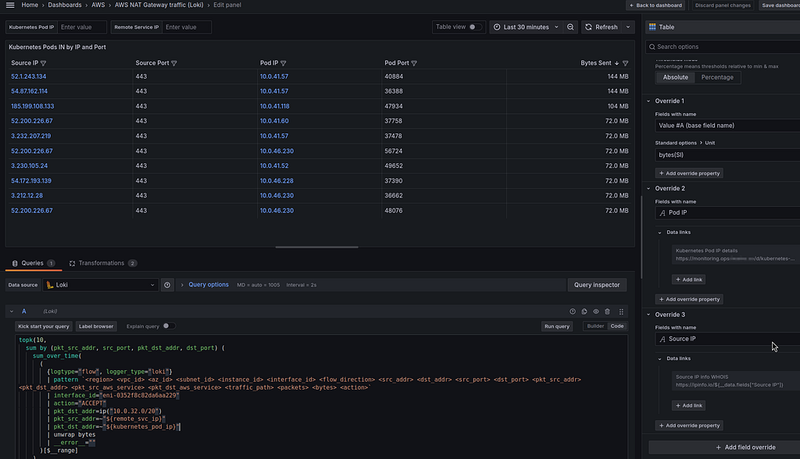
Kubernetes Pods IN by IP and Port
It remains to display information on IP and ports, it can be useful when determining the service that generates traffic — see pkt_src_aws_service, pkt_dst_aws_service, and finding a service.
Loki query
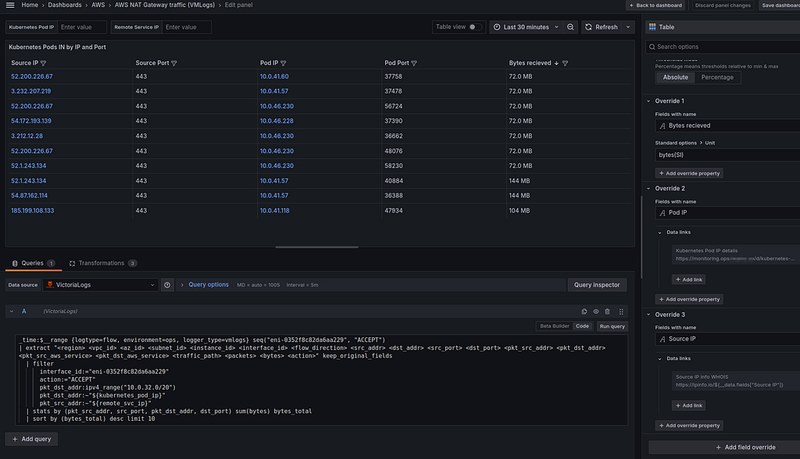
Use the Table visualization type and the following query:
topk(10,
  sum by (pkt_src_addr, src_port, pkt_dst_addr, dst_port) (
    sum_over_time(
      (
        {logtype="flow", logger_type="loki"}
        | pattern `<region> <vpc_id> <az_id> <subnet_id> <instance_id> <interface_id> <flow_direction> <src_addr> <dst_addr> <src_port> <dst_port> <pkt_src_addr> <pkt_dst_addr> <pkt_src_aws_service> <pkt_dst_aws_service> <traffic_path> <packets> <bytes> <action>`
        | interface_id="eni-0352f8c82da6aa229"
        | action="ACCEPT"
        | pkt_dst_addr=ip("10.0.32.0/20")
        | pkt_src_addr=~"${remote_svc_ip}"
        | pkt_dst_addr=~"${kubernetes_pod_ip}"
        | unwrap bytes
        | __error__ =""
      )[$__range]
    )
  )
)
In the Fields override, set the Unit of the Value field to the “bytes(SI)”, and for each column — set its own Data link.
We can change the column headers and hide the Time field in Transformations:
VictoriaLogs query
The query here will be like this:
_time:$__range {logtype=flow, environment=ops, logger_type=vmlogs} seq("eni-0352f8c82da6aa229", "ACCEPT")
| extract "<region> <vpc_id> <az_id> <subnet_id> <instance_id> <interface_id> <flow_direction> <src_addr> <dst_addr> <src_port> <dst_port> <pkt_src_addr> <pkt_dst_addr> <pkt_src_aws_service> <pkt_dst_aws_service> <traffic_path> <packets> <bytes> <action>"
  | filter
      interface_id:="eni-0352f8c82da6aa229"
      action:="ACCEPT"
      pkt_dst_addr:ipv4_range("10.0.32.0/20")
      pkt_dst_addr:~"${kubernetes_pod_ip}"
      pkt_src_addr:~"${remote_svc_ip}"
  | stats by (pkt_src_addr, src_port, pkt_dst_addr, dst_port) sum(bytes) bytes_total
  | sort by (bytes_total) desc limit 10
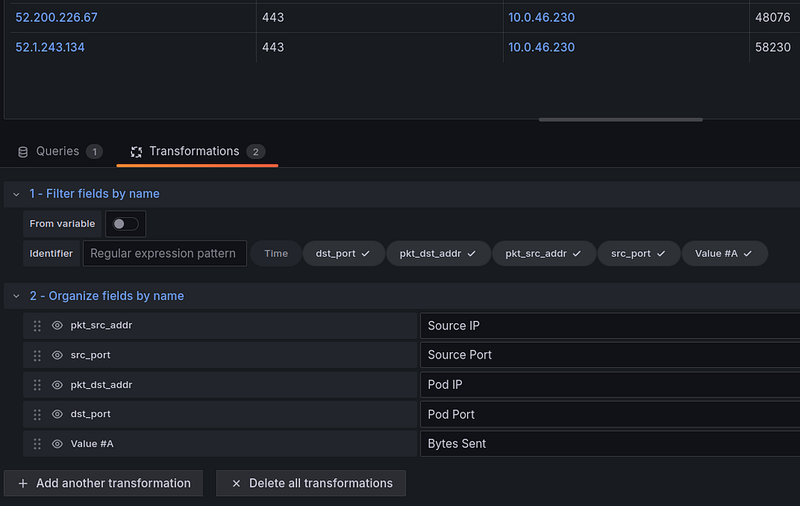
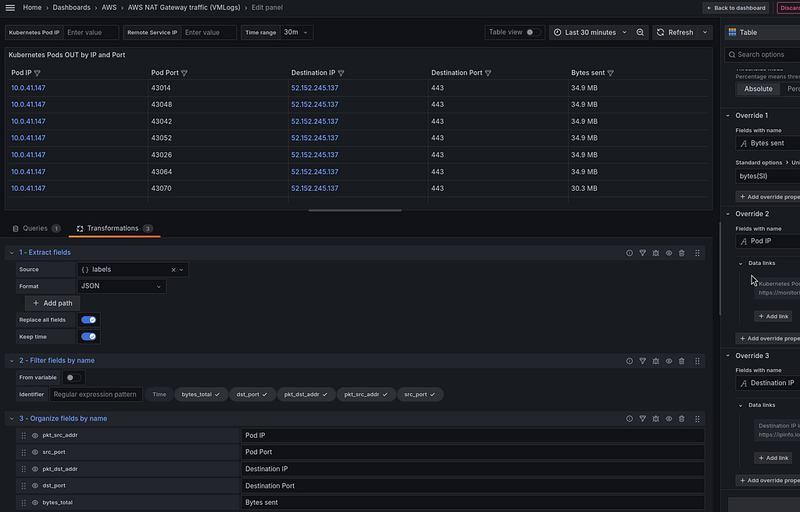
Since VictoriaLogs returns (so far) the results in JSON, we’ll add the “Extract fields” Transformation.
In the “Filter fields by name”, just like for Loki, we remove the “Time” column.
And in the “Organize fields by name”, we change the column headings and sorting of the columns:
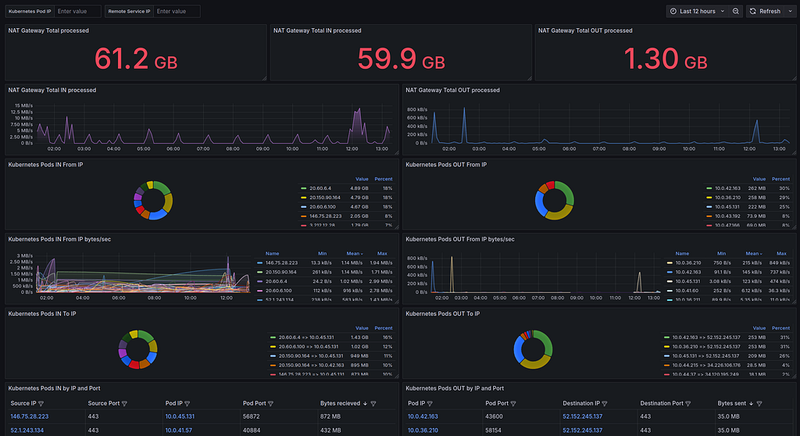
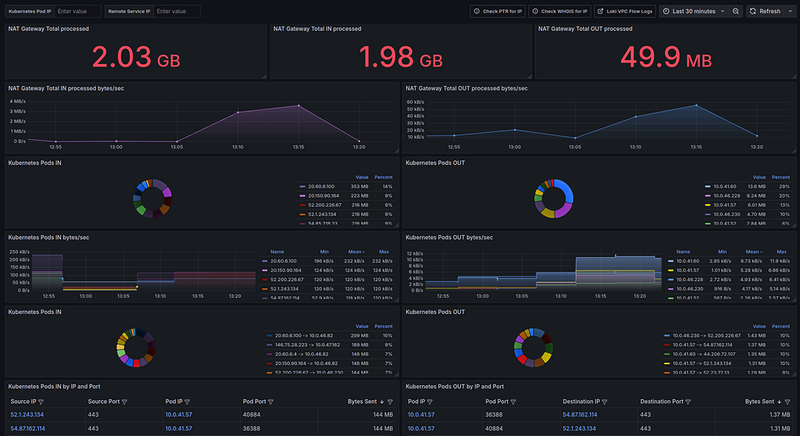
The final Grafana dashboard result, and performance of Loki vs VictoriaLogs
The result with the VictoriaLogs for 12 (!) hours range:
And CPU/memory resources used:
$ kk top pod atlas-victoriametrics-victoria-logs-single-server-0
NAME CPU(cores) MEMORY(bytes)
atlas-victoriametrics-victoria-logs-single-server-0 2754m 34Mi
The result with the Loki for only 30 minutes range:
And CPU/memory resources used:
$ kk top pod -l app.kubernetes.io/name=loki,app.kubernetes.io/component=read
NAME CPU(cores) MEMORY(bytes)
loki-read-89fbb8f5c-874xq 683m 402Mi
loki-read-89fbb8f5c-8qpdw 952m 399Mi
loki-read-89fbb8f5c-qh8dg 848m 413Mi
And that’s it for now.
It remains to wait for minor updates on the datasource and VictoriaLogs itself.
What’s next?
And then I still want to have fields with Kubernetes Pods IP and external resource addresses in the log fields rather than parsing them in the VictoriaLogs dashboard itself.
Then it will be possible to make samples for several days or maybe even weeks.
To achieve this, we can try the vector.dev to use it to collect logs from S3, perform transformations, add fields there, and then write these logs to VictoriaLogs.
I’ll probably try it when I have time, because it looks like a very interesting solution.
Originally published at RTFM: Linux, DevOps, and system administration.






Top comments (0)