AWS: VPC Flow Logs — logs to S3 and Grafana dashboard with Loki
Continuing the topic about AWS: VPC Flow Logs, NAT Gateways, and Kubernetes Pods — a detailed overview.
There we analyzed how to work with VPC Flow Logs in general, and learned how we can get information about traffic to/from Kubernetes Pods.
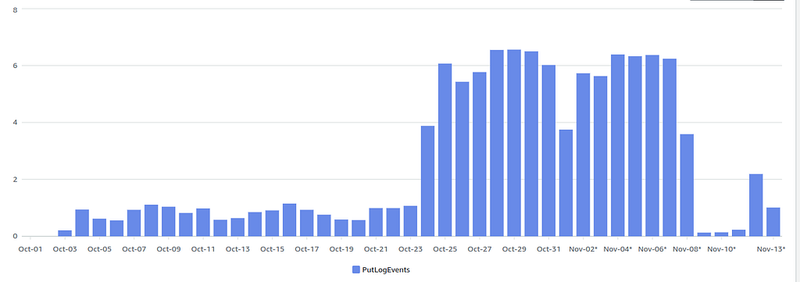
But there is one problem when using Flow Logs with CloudWatch Logs — the cost.
For example, when we enable Flow Logs, and they are written to CloudWatch Logs, even in a small project with little traffic the spends on CloudWatch Logs look like this — October 23rd enabled, November 8th disabled:
So instead of using CloudWatch Logs we can do something different: write Flow Logs to an AWS S3 bucket, and from there fetch them with Promtail, and write them to Grafana Loki, see Grafana Loki: collecting AWS LoadBalancer logs from S3 with Promtail Lambda. And having the logs in Loki, we can have alerts with VMAlert/Alertmanager and dashboards in Grafana.
The main problem we want to solve now with VPC Flow Logs is to determine who sends a lot of traffic through the NAT Gateway, because it also eats up our money.
The second task is to have a general picture and some traffic alerts in the future.
So, what are we going to do:
- will create an AWS S3 bucket for logs
- will create a Lambda function with a Promtail instance that will write logs from the bucket to Grafana Loki
- will see what we have in the logs that is interesting and what can be useful for us in terms of traffic
- will create a Grafana Dashboard
Contents
- Our infrastructure
- Terraform and VPC Flow Logs to S3
- Analyzing a NAT Gateway records in the VPC Flow Logs — NAT Gateway, and traffic_path — pkt_src_aws_service, pkt_dst_aws_service, and finding a service
- Creating Grafana dashboard — NAT Gateway total traffic processed — NAT Gateway Egress and Ingress traffic processed — Stat — The dashboard variables — $kubernetes_pod_ip та $remote_svc_ip — Loki Recording Rules, fields, High Cardinality issue, and performance — NAT Gateway та traffic processed — graphs — Kubernetes services that generate the most traffic — Grafana Data links — Remote services that generate the most traffic — Services in Kubernetes that generate the most traffic: a table with ports
- Grafana dashboard: the final result
Our infrastructure
First, let’s take a look at our project.
We have:
- VPC with 8 subnets — 2 public, 2 private — for Kubernetes Pods, 2 intra — for Kubernetes Control Plane, and 2 for databases — RDS instances (see Terraform: Building EKS, part 1 — VPC, Subnets and Endpoints) — 1 NAT Gateway for traffic from private networks — 1 Internet Gateway for traffic from/to public networks
- AWS Elastic Kubernetes Cluster with Karpenter EC2 auto-scaler — creates WorkerNodes in VPC Private Subnets (see Terraform: building EKS, part 3 — Karpenter installation)
- VictoriaMetrics stack for monitoring and Grafana for dashboards (see VictoriaMetrics: deploying a Kubernetes monitoring stack)
Terraform and VPC Flow Logs to S3
The creation of the S3 buckets and the Lambda functions is described in Terraform: creating a module for collecting AWS ALB logs in Grafana Loki, so I won’t go into detail here.
Just a note, that the module was created to collect AWS Load Balancers logs, so the names there will contain_”alb”_, I’ll rewrite it to pass the names of buckets and functions as a parameters.
The only thing to keep in mind: VPC Flow Logs writes a lot of data, so you should add a longer timeout for Lambda, because some of the records were lost due to the Lambda error ”Task timed out after 3.05 seconds ”.
...
module "promtail_lambda" {
  source = "terraform-aws-modules/lambda/aws"
  version = "~> 7.8.0"
  # key: dev
  # value: ops-1-28-backend-api-dev-alb-logs
  for_each = aws_s3_bucket.alb_s3_logs

  # <aws_env>-<eks_version>-<component>-<application>-<app_env>-alb-logs-logger
  # bucket name: ops-1-28-backend-api-dev-alb-logs
  # lambda name: ops-1-28-backend-api-dev-alb-logs-loki-logger
  function_name = "${each.value.id}-loki-logger"
  description = "Promtail instance to collect logs from ALB Logs in S3"

  create_package = false
  # https://github.com/terraform-aws-modules/terraform-aws-lambda/issues/36
  publish = true

  # an error when sending logs from Flow Logs S3:
  # 'Task timed out after 3.05 seconds'
  timeout = 60
...
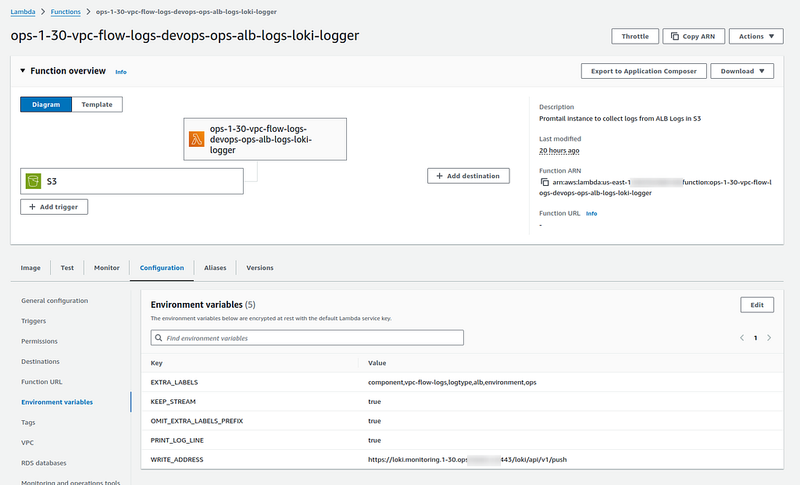
So, we have an AWS S3 bucket, we have a Lambda that will receive notifications about new objects creation in this bucket, and then Promtail from this Lambda function gets these logs from the bucket, and sends them to a Loki instance via Internal LoadBalancer:
When transferring logs to Loki, Promtail adds several new labels — component=vpc-flow-logs, logtype=alb, environment=ops. We can then use them in metrics and Grafana dashboards.
-
logtype=alb, then again, the module was written for ALB logs, and this will need to be changed_
Now we need to configure Flow Logs for our VPC.
There are several options in the terraform-aws-modules/vpc/aws module for this:
...
  enable_flow_log = var.vpc_params.enable_flow_log

  # Default: "cloud-watch-logs"
  flow_log_destination_type = "s3"

  # disalbe to use S3
  create_flow_log_cloudwatch_log_group = false
  create_flow_log_cloudwatch_iam_role = false

  # ARN of the a CloudWatch log group or an S3 bucket
  # disable if use 'create_flow_log_cloudwatch_log_group' and the default 'flow_log_destination_type' value (cloud-watch-logs)
  flow_log_destination_arn = "arn:aws:s3:::ops-1-30-vpc-flow-logs-devops-ops-alb-logs"

  # set 60 to use more detailed recoring
  flow_log_max_aggregation_interval = 600
  # when use CloudWatch Logs, set this prefix
  flow_log_cloudwatch_log_group_name_prefix = "/aws/${local.env_name}-flow-logs/"

  # set custom log format for more detailed information
  flow_log_log_format = "$${region} $${vpc-id} $${az-id} $${subnet-id} $${instance-id} $${interface-id} $${flow-direction} $${srcaddr} $${dstaddr} $${srcport} $${dstport} $${pkt-srcaddr} $${pkt-dstaddr} $${pkt-src-aws-service} $${pkt-dst-aws-service} $${traffic-path} $${packets} $${bytes} $${action}"

...
We are interested in the following parameters here:
-
flow_log_destination_type: instead of the default cloud-watch-logs, we set s3 -
create_flow_log_cloudwatch_log_groupandcreate_flow_log_cloudwatch_iam_role: disable the creation of resources for CloudWatch Logs -
flow_log_destination_arn: set the ARN of the S3 bucket to which logs will be written -
flow_log_log_format: create a custom format to have additional information including Kubernetes Pods IPs, see VPC Flow Log - Custom format
Run terraform apply, and check your VPC:
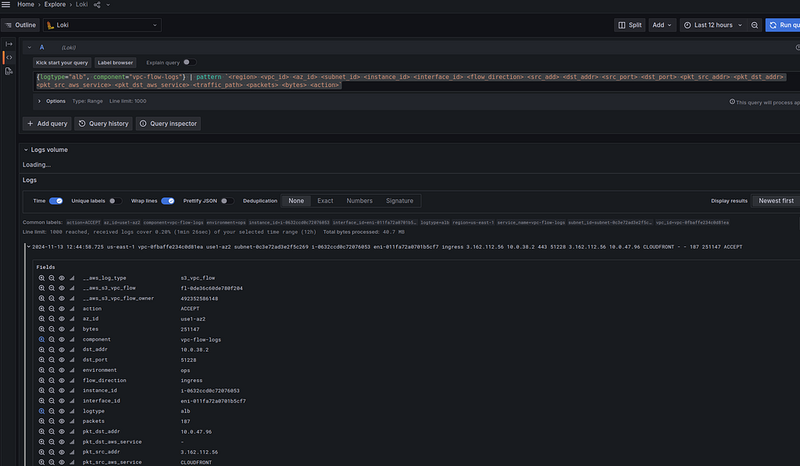
And after 10 minutes, check the logs in Grafana Loki:
Great, the logs are coming.
Next, we add a pattern parser to the Loki query to generate fields in the records:
{logtype="alb", component="vpc-flow-logs"} | pattern `<region> <vpc_id> <az_id> <subnet_id> <instance_id> <interface_id> <flow_direction> <src_add> <dst_addr> <src_port> <dst_port> <pkt_src_addr> <pkt_dst_addr> <pkt_src_aws_service> <pkt_dst_aws_service> <traffic_path> <packets> <bytes> <action>`
Okay. Now that we have logs and fields, we can think about metrics with Loki Recording Rules, and about a Grafana dashboard.
Analyzing a NAT Gateway records in the VPC Flow Logs
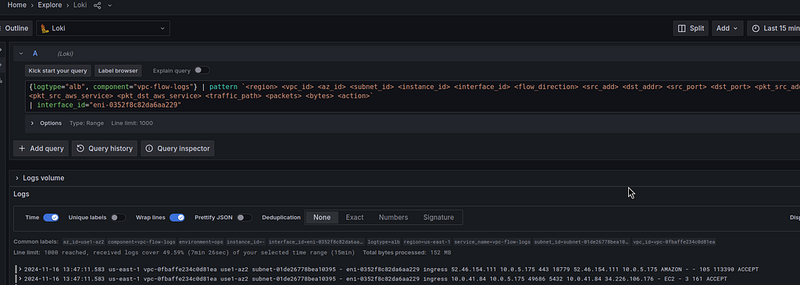
First, let’s see all the traffic through the NAT Gateway — add a filter by the interface_id="eni-0352f8c82da6aa229":
{logtype="alb", component="vpc-flow-logs"} | pattern `<region> <vpc_id> <az_id> <subnet_id> <instance_id> <interface_id> <flow_direction> <src_add> <dst_addr> <src_port> <dst_port> <pkt_src_addr> <pkt_dst_addr> <pkt_src_aws_service> <pkt_dst_aws_service> <traffic_path> <packets> <bytes> <action>`
| interface_id="eni-0352f8c82da6aa229"
What do we see here?
For example, in the first entry:
ingress 52.46.154.111 10.0.5.175 443 18779 52.46.154.111 10.0.5.175 AMAZON — — 105 113390 ACCEPT
Here:
- ingress : packet went to the NAT Gateway interface
-
52.46.154.111 : this is
src_addr- some remote server -
10.0.5.175 : this is
dst_addr- the private IP of our NAT Gateway -
443 : this is
src_port- where the packet came from -
18779 : this is
dst_port- where the packet came from -
52.46.154.111 and 10.0.5.175 : this is
pkt_src_addrandpkt_dst_addrrespectively, the values are the same as in5432src_addranddst_addr- that is, the traffic is clearly "pure NAT", as we analyzed in From Remote Server to NAT Gateway - AMAZON : the service from which the packet was received (but more on that later)
-
pkt_dst_aws_serviceandtraffic_path: empty - 105 : number of packets
- 113390 : number of bytes
- ACCEPT : packet passed through Security Group/WAF
And in the next entry, we see dst_port 5432 - here the traffic is clearly to PostgreSQL RDS.
NAT Gateway, and the traffic_path
Here are some interesting things you can see in the logs.
First, it is traffic_path. Sometimes you can see value "8" in the logs that are connected to the NAT Gateway, that is,"Through an internet gateway" - see Available fields.
Why Internet Gateway? Because the traffic comes from the private network to the NAT Gateway, but then it goes to the Internet through the Internet Gateway — see One to Many: Evolving VPC Design.
pkt_src_aws_service, pkt_dst_aws_service, and finding a service
A note about addresses that are not from our network, that is, some external services.
In the pkt_src_aws_service and pkt_dst_aws_service fields, you can often see an entry like_"EC2_" or_"AMAZON_" - but this does not tell us anything.
Moreover, the AWS Technical Support itself could not tell me what kind of services the packets are going to.
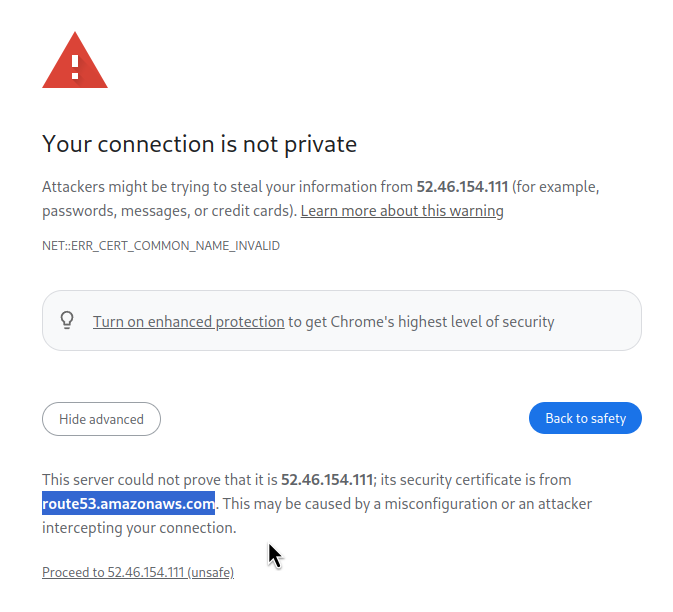
But here is a dirty hack: if we see port 443 in src_port/dst_port, we can simply open the IP in the browser where we will get an SSL error, and the error will contain the name of the service for which this certificate was issued.
For example, above we saw that pkt_src_aws_service == AMAZON. If you open https://52.46.154.111, you will see what exactly is on this IP:
Similarly, there will be records like monitoring.us-east-1.amazonaws.com for AWS CloudWatch or athena.us-east-1.amazonaws.com for AWS Athena.
Creating Grafana dashboard
Now let’s try to create a Grafana dashboard.
Planning
So, the main goal is to have an idea of the traffic that goes through the AWS NAT Gateway.
What do we know and have?
- we know the CIDR of the VPC Private Subnets for Kubernetes Pods
- we know the Elastic Network Interface ID, Public IP and Private IP for the NAT Gateway — in my current case, we have an only one, so everything is simple here
- in the logs we have IPs of Kubernetes Pods and some external resources
- in the logs we have the direction of traffic through the NAT Gateway interface — IN/OUT (ingress/egress, or RX/TX — Received and Transmitted)
What would we like to see on the dashboard?
- the total traffic volume that passed through the NAT Gateway and for which we paid
- the total amount of NAT Gateway traffic in the ingress/egress direction
- Kubernetes services/applications that generate the most traffic
- AWS services and external resources that generate traffic — for this we have the
pkt-src-aws-serviceandpkt-dst-aws-servicefields - action with
ACCEPTandREJECTpackets - can be useful if you have AWS Web Application Firewall, or you are interested in VPC Network Access List triggers - Availability Zones to define cross-AZ traffic — but this is not in our case, because we have everything in one zone
-
traffic-path- can be useful to determine what type of traffic is going - inside the VPC, through the VPC Endpoint, etc. (although I, personally, did not use it in the dashboard)
NAT Gateway total traffic processed
We can get the sum of all traffic for a period of time with the following query:
sum (
    sum_over_time(
        ({logtype="alb", component="vpc-flow-logs", __aws_s3_vpc_flow="fl-01e52787e4495dfee"} | pattern `<region> <vpc_id> <az_id> <subnet_id> <instance_id> <interface_id> <flow_direction> <src_add> <dst_addr> <src_port> <dst_port> <pkt_src_addr> <pkt_dst_addr> <pkt_src_aws_service> <pkt_dst_aws_service> <traffic_path> <packets> <bytes> <action>`
        | interface_id="eni-0352f8c82da6aa229"
        | unwrap bytes
        | __error__ =""
        )[$__range]
    )
)
We use [$__range] to take the time interval specified in the Grafana dashboard. In sum_over_time, we count all the bytes during this time, and "wrap" everything in the sum() to get a simple number.
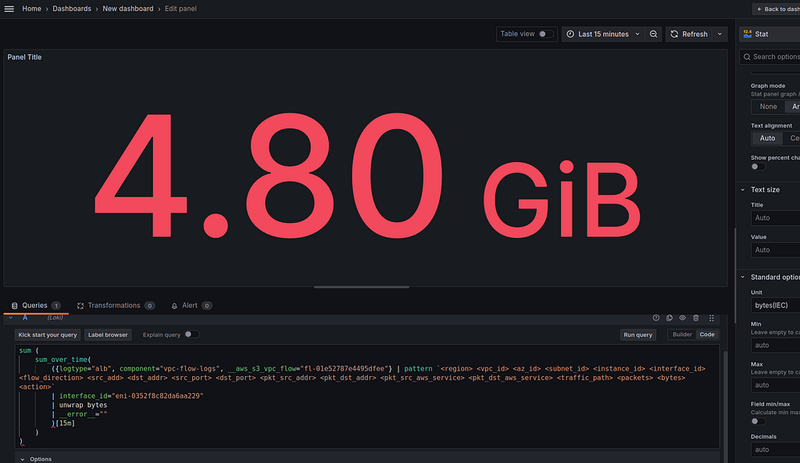
For the “Total traffic processed” panel, you can take the Stat visualization type, use the Unit with Bytes(IEC), and it will look like this:
Here we have 5.8 GB in 15 minutes.
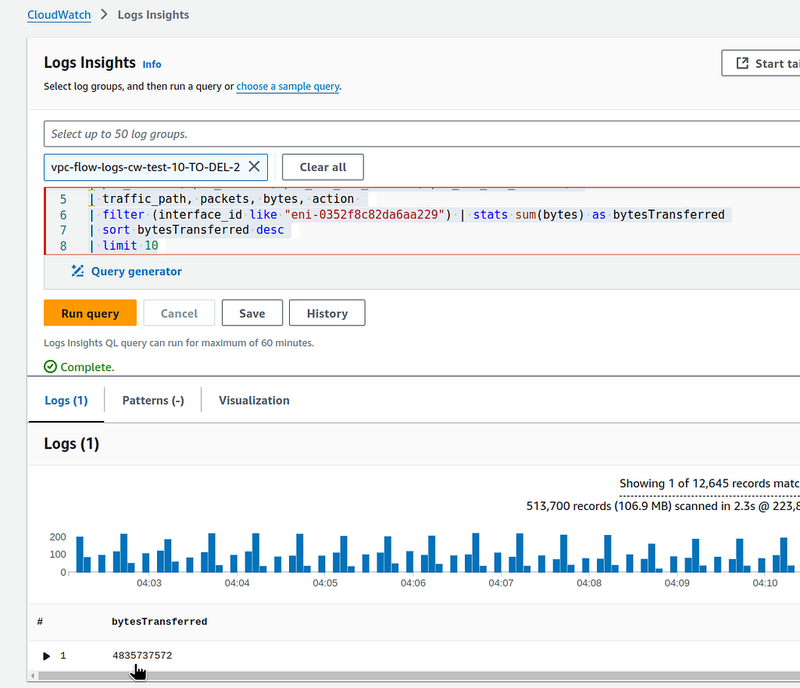
Let’s check Flow Logs in CloudWatch, where we can make such a query for comparison:
parse @message "* * * * * * * * * * * * * * * * * * *"
| as region, vpc_id, az_id, subnet_id, instance_id, interface_id,
| flow_direction, srcaddr, dstaddr, srcport, dstport,
| pkt_srcaddr, pkt_dstaddr, pkt_src_aws_service, pkt_dst_aws_service,
| traffic_path, packets, bytes, action
| filter (interface_id like "eni-0352f8c82da6aa229") | stats sum(bytes) as bytesTransferred
| sort bytesTransferred desc
| limit 10
Here, in the same 15 minutes, we have 4835737572 bytes, which is the same 4.8 gigabytes.
Okay — we have the total traffic.
Let’s add the Egress and Ingress displays.
NAT Gateway Egress and Ingress traffic processed — Stat
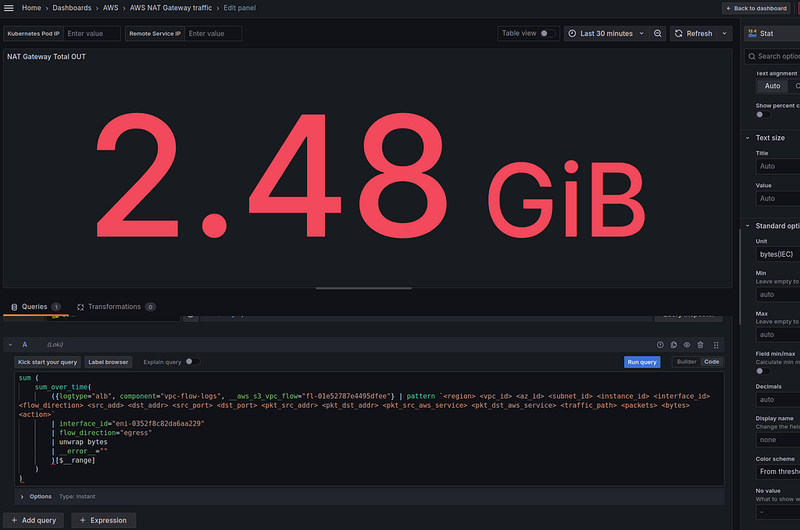
Everything is the same here, just add the | flow_direction="egress" or "ingress" filter, respectively:
sum (
    sum_over_time(
        ({logtype="alb", component="vpc-flow-logs", __aws_s3_vpc_flow="fl-01e52787e4495dfee"} | pattern `<region> <vpc_id> <az_id> <subnet_id> <instance_id> <interface_id> <flow_direction> <src_add> <dst_addr> <src_port> <dst_port> <pkt_src_addr> <pkt_dst_addr> <pkt_src_aws_service> <pkt_dst_aws_service> <traffic_path> <packets> <bytes> <action>`
        | interface_id="eni-0352f8c82da6aa229"
        | flow_direction="egress"
        | unwrap bytes
        | __error__ =""
        )[$__range]
    )
)
Since our panel is of the Stat type which simply displays a number, it makes sense to set the Type == Instant in the Options to reduce the load on Grafana and Loki.
The dashboard variables — $kubernetes_pod_ip and $remote_svc_ip
First of all, we are interested in traffic from/to Kubernetes Pods, because almost all of our services live there.
Secondly, we want to be able to select data only for the selected pkt_src_addr and pkt_dst_addr - it can be either a Kubernetes Pod or some external service, depending on the ingress/egress traffic.
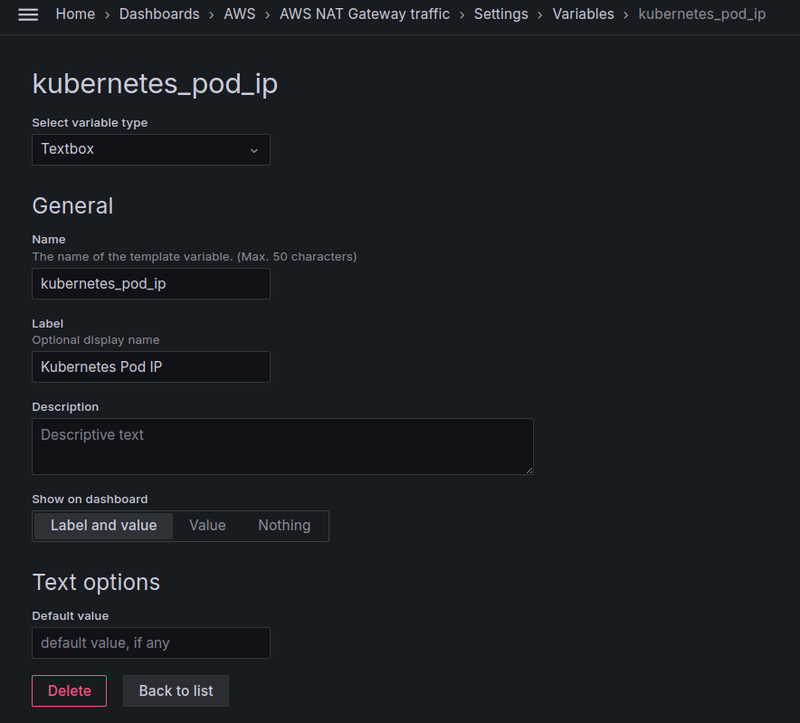
Since we operate with the “raw” log entries, and not metrics with labels, we can’t just take values from the fields, so I added two variables with the Textbox type, where you can enter the IP manually:
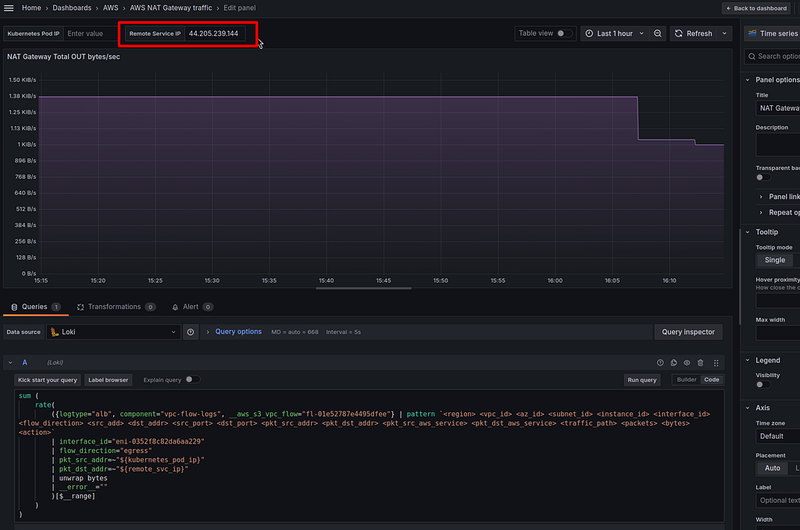
And then we can add these variables to all our queries with the regular expression pkt_src_addr=~"${kubernetes_pod_ip}" so that the query will work if the variable has no value:
sum (
    sum_over_time(
        ({logtype="alb", component="vpc-flow-logs", __aws_s3_vpc_flow="fl-01e52787e4495dfee"} | pattern `<region> <vpc_id> <az_id> <subnet_id> <instance_id> <interface_id> <flow_direction> <src_add> <dst_addr> <src_port> <dst_port> <pkt_src_addr> <pkt_dst_addr> <pkt_src_aws_service> <pkt_dst_aws_service> <traffic_path> <packets> <bytes> <action>`
        | interface_id="eni-0352f8c82da6aa229"
        | flow_direction="egress"
        | pkt_src_addr=~"${kubernetes_pod_ip}"
        | pkt_dst_addr=~"${remote_svc_ip}"
        | unwrap bytes
        | __error__ =""
        )[$__range]
    )
)
Loki Recording Rules, fields, High Cardinality issue, and performance
Why do we work with the raw log entries rather than metrics with labels?
We could create a Recording Rule for Loki like this:
...
        - record: aws:nat:egress_bytes:sum:15m
          expr: |
            sum (
                sum_over_time(
                    ({logtype="alb", component="vpc-flow-logs", __aws_s3_vpc_flow="fl-01e52787e4495dfee"} | pattern `<region> <vpc_id> <az_id> <subnet_id> <instance_id> <interface_id> <flow_direction> <src_add> <dst_addr> <src_port> <dst_port> <pkt_src_addr> <pkt_dst_addr> <pkt_src_aws_service> <pkt_dst_aws_service> <traffic_path> <packets> <bytes> <action>`
                    | interface_id="eni-0352f8c82da6aa229"
                    | flow_direction="egress"
                    | pkt_src_addr=ip("10.0.32.0/20")
                    | unwrap bytes
                    | __error__ =""
                    )[15m]
                )
            )
...
But if this is a good option with data such as “total processed bytes”, then later, when we create panels with information by IPs, we will have a problem with how to store these IPs in metrics.
If we put the values from the pkt_src_addr and pkt_dst_addr into the metric labels, this will lead to the fact that Loki will create a separate set of data chunks for each unique set of labels.
And since we may have a lot of IPs in the VPC, and there may be even more external IPs, we can get millions of data chunks, which will affect both the cost of storing data in AWS S3 and the performance of Loki itself and VictoriaMetrics or Prometheus, because they will have to upload and process all this data about query execution to Grafana. See Loki Recording Rules, Prometheus/VictoriaMetrics, and High Cardinality.
In addition, labels in metrics should generally be used to “describe” the metric and allow data selection, but not to store any data for later use. That is, a label is a tag that “describes” a metric , but not a field for passing parameters.
Therefore, there is an option to either accept the high cardinality issue and not follow best practices, or use raw logs in dashboards.
When working with raw logs in Loki and Grafana we limit ourselves, of course, because on requests for a relatively long period of time — for example, several hours — Loki starts to eat resources like crazy, see the CPU column — almost 3–4 cores are fully occupied by each Kubernetes Pod for the Loki Read component:
I may still try to create Recording Rules with IPs in the labels to see how it affects the system. As long as we are a small startup and have little traffic, this may still be an option. But for large volumes, it’s better not to do this.
Another solution is to try using VictoriaLogs (see VictoriaLogs: an overview, run in Kubernetes, LogsQL, and Grafana), which is much better able to handle big volume of raw logs, and I will most likely be reworking this schema with VictoriaLogs next week, especially since VictoriaLogs itself has already received its first release, and its Grafana datasource will be officially added to Grafana soon.
In addition, VictoriaLogs has already added support for Recording Rules and alerts — see vmalert.
NAT Gateway та traffic processed — graphs
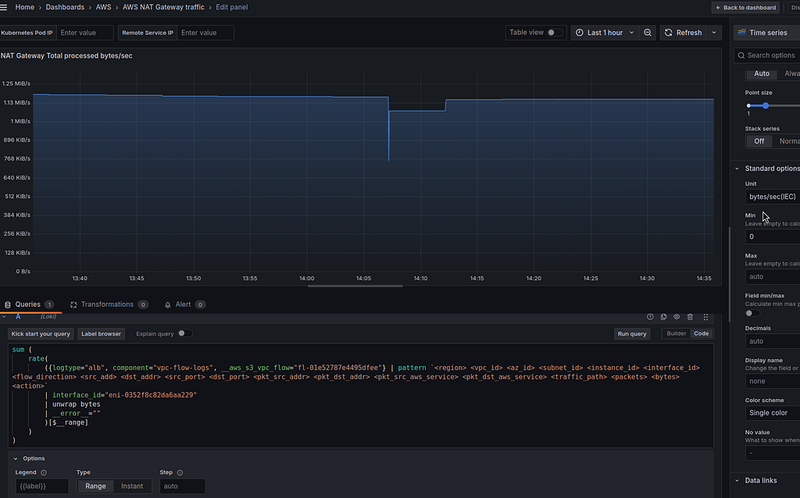
In the addition to the simple Stat panels, it can be useful to create graphs to get an idea of how certain changes affected traffic.
Here, the query can be similar, but instead of the sum_over_time(), we use rate(), in the Options we use Type == Range, and in the Standard Options > Unit we set "bytes/sec":
sum (
    rate(
        ({logtype="alb", component="vpc-flow-logs", __aws_s3_vpc_flow="fl-01e52787e4495dfee"} | pattern `<region> <vpc_id> <az_id> <subnet_id> <instance_id> <interface_id> <flow_direction> <src_add> <dst_addr> <src_port> <dst_port> <pkt_src_addr> <pkt_dst_addr> <pkt_src_aws_service> <pkt_dst_aws_service> <traffic_path> <packets> <bytes> <action>`
        | interface_id="eni-0352f8c82da6aa229"
        | unwrap bytes
        | __error__ =""
        )[15m]
    )
)
For the rate() here, we take a period of 15 minutes, because our logs are written once every 10 minutes - the default value for flow_log_max_aggregation_interval in the terraform-aws-modules/vpc/aws module.
Kubernetes services that generate the most traffic
Next, we want to see the IPs from Kubernetes Pods that generate traffic.
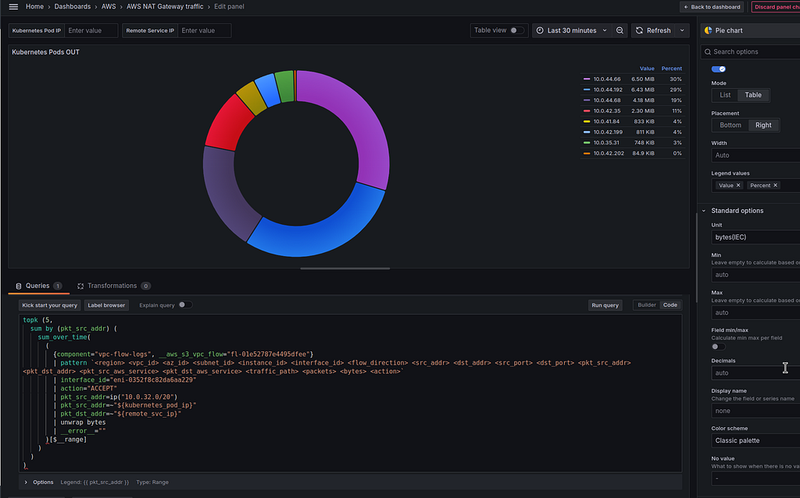
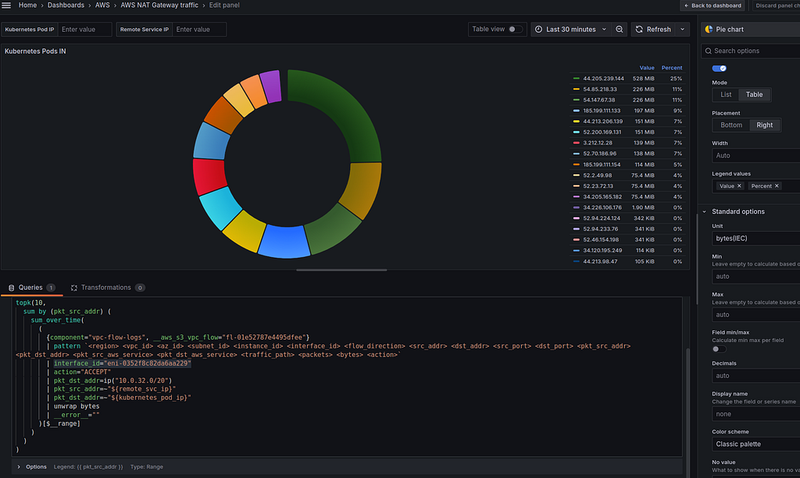
Here we can create a visualization with the Pie chart type and the following query:
topk (5,
  sum by (pkt_src_addr) (
    sum_over_time(
      (
        {component="vpc-flow-logs", __aws_s3_vpc_flow="fl-01e52787e4495dfee"}
        | pattern `<region> <vpc_id> <az_id> <subnet_id> <instance_id> <interface_id> <flow_direction> <src_addr> <dst_addr> <src_port> <dst_port> <pkt_src_addr> <pkt_dst_addr> <pkt_src_aws_service> <pkt_dst_aws_service> <traffic_path> <packets> <bytes> <action>`
        | interface_id="eni-0352f8c82da6aa229"
        | action="ACCEPT"
        | pkt_src_addr=ip("10.0.32.0/20")
        | pkt_src_addr=~"${kubernetes_pod_ip}"
        | pkt_dst_addr=~"${remote_svc_ip}"
        | unwrap bytes
        | __error__ =""
      )[$__range]
    )
  )
)
We use the ip() with the CIDR of our private network to select entries with only the IPs of our Kubernetes Pods (see Matching IP addresses), and topk(5) to display only those Pods that generate the most traffic.
As a result, we have the following picture:
We have an 10.0.44.66 IP in the top — let’s see what kind of service it is:
$ kk get pod -A -o wide | grep -w 10.0.44.66
dev-backend-api-ns backend-celery-workers-deployment-b68f88f74-rzq4j ... 10.0.44.66 ...
There is such a Kubernetes Pod, okay. Now we have an idea who is sending a lot of traffic.
Grafana Data links
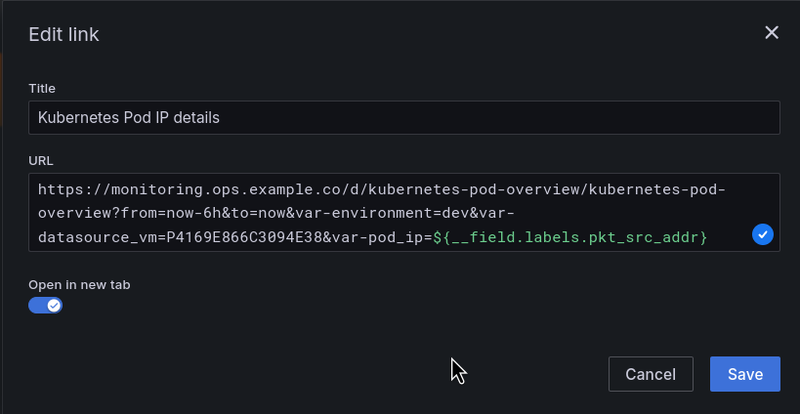
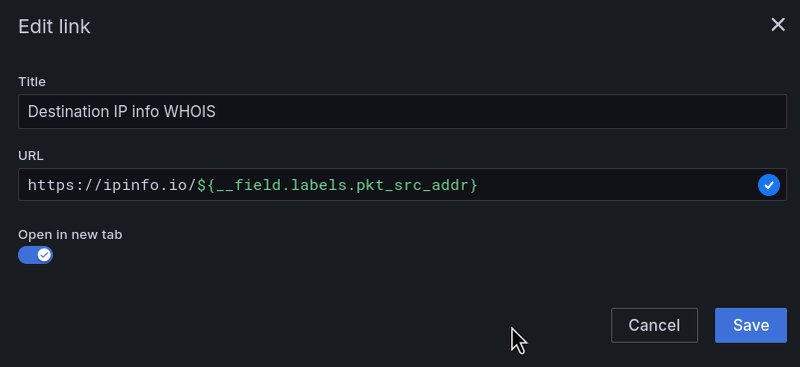
To quickly get information about an IP and which Kubernetes Pod it belongs to, we can add Grafana Data Links.
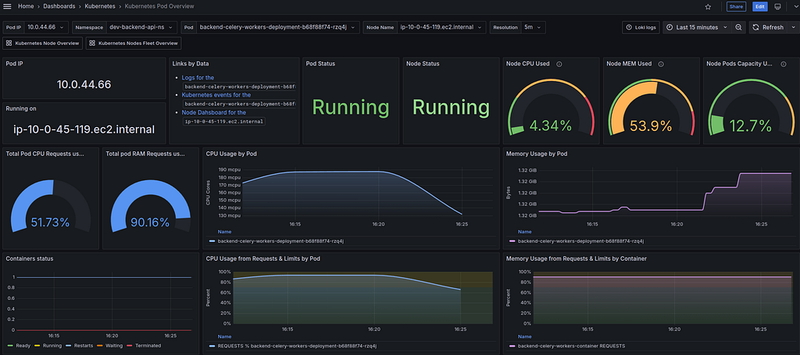
For example, I have a separate Grafana dashboard where I can get all the information about a Pod by its IP.
Then we can create a Data link with the field ${__field.labels.pkt_src_addr}:
And the dashboard for the 10.0.44.66 IP:
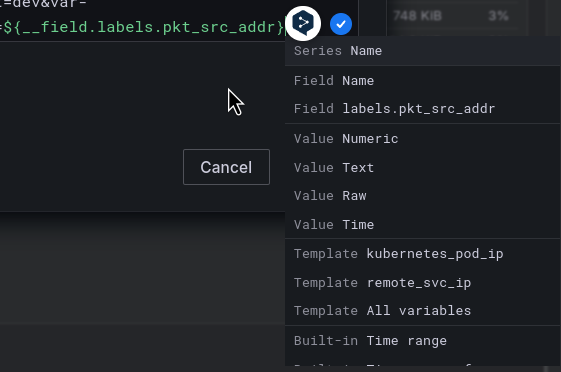
All available fields for the Data links can be accessed with Ctrl+Space:
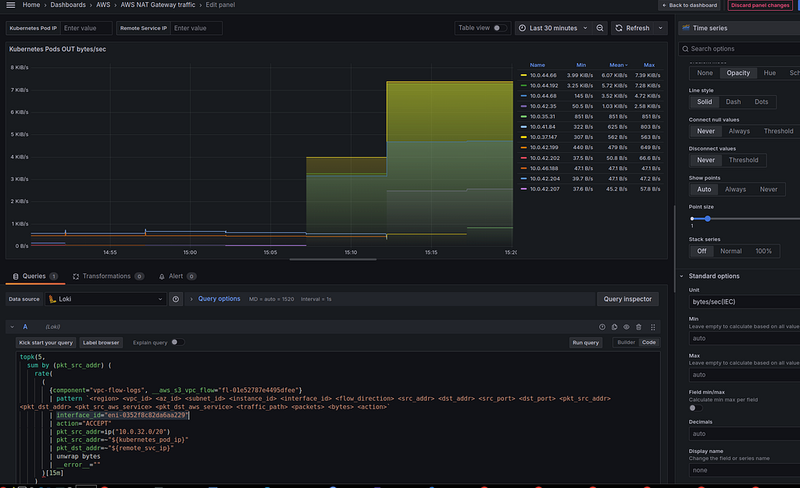
Or, instead of (or in addition to) the Pie chart, we can create a regular graph to get a “historical picture”, as we did for the “NAT Gateway Total traffic” panel:
topk(5,
  sum by (pkt_src_addr) (
    rate(
      (
        {component="vpc-flow-logs", __aws_s3_vpc_flow="fl-01e52787e4495dfee"}
        | pattern `<region> <vpc_id> <az_id> <subnet_id> <instance_id> <interface_id> <flow_direction> <src_addr> <dst_addr> <src_port> <dst_port> <pkt_src_addr> <pkt_dst_addr> <pkt_src_aws_service> <pkt_dst_aws_service> <traffic_path> <packets> <bytes> <action>`
        | interface_id="eni-0352f8c82da6aa229"
        | action="ACCEPT"
        | pkt_src_addr=ip("10.0.32.0/20")
        | pkt_src_addr=~"${kubernetes_pod_ip}"
        | pkt_dst_addr=~"${remote_svc_ip}"
        | unwrap bytes
        | __error__ =""
      )[15m]
    )
  )
)
Remote services that generate the most traffic
Now that we have the information about Kubernetes Pods, let’s see where most of the traffic comes from.
Everything is the same here, but we filter by the pkt_dst_addr=ip("10.0.32.0/20") - that is, we select all records where the packet goes from the outside to the NAT Gateway, and then to our Pods:
topk(10,
  sum by (pkt_src_addr) (
    sum_over_time(
      (
        {component="vpc-flow-logs", __aws_s3_vpc_flow="fl-01e52787e4495dfee"}
        | pattern `<region> <vpc_id> <az_id> <subnet_id> <instance_id> <interface_id> <flow_direction> <src_addr> <dst_addr> <src_port> <dst_port> <pkt_src_addr> <pkt_dst_addr> <pkt_src_aws_service> <pkt_dst_aws_service> <traffic_path> <packets> <bytes> <action>`
        | interface_id="eni-0352f8c82da6aa229"
        | action="ACCEPT"
        | pkt_dst_addr=ip("10.0.32.0/20")
        | pkt_src_addr=~"${remote_svc_ip}"
        | pkt_dst_addr=~"${kubernetes_pod_ip}"
        | unwrap bytes
        | __error__ =""
      )[$__range]
    )
  )
)
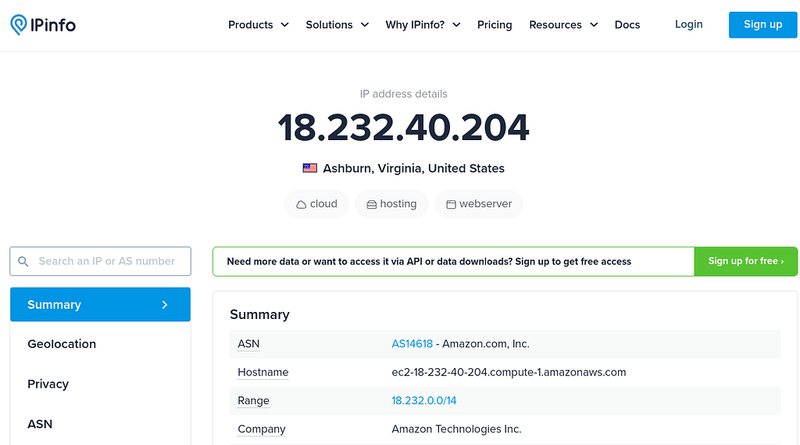
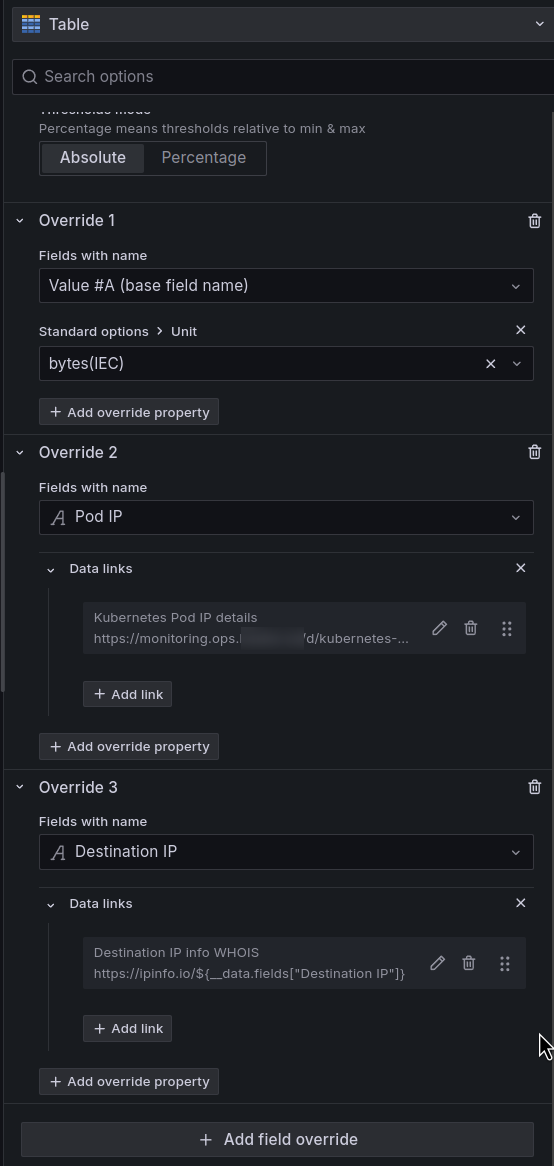
And in the Data Links, we can use the https://ipinfo.io service and the pkt_src_addr field:
Services in Kubernetes that generate the most traffic: a table with ports
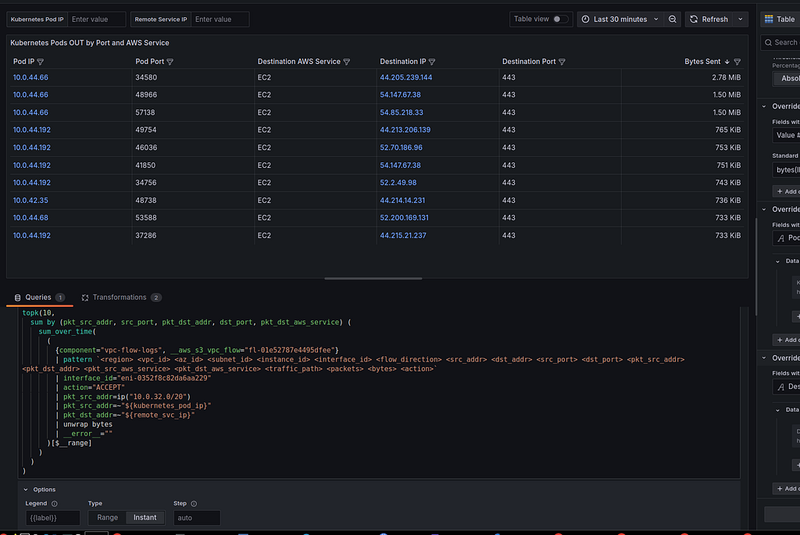
Separately, we can add a table with a little more information about each log entry.
Why separate — because here we are making a query with a large sample of several fields, and because of this, Loki will have to pull additional data. Therefore, for requests for a long period of time, it is better not to load one table, but have other graphs.
Let’s add a display of ports to the table — it will be useful when defining a service.
Create a visualization with the Table type and the following query:
topk(10,
  sum by (pkt_src_addr, src_port, pkt_dst_addr, dst_port, pkt_dst_aws_service) (
    sum_over_time(
      (
        {component="vpc-flow-logs", __aws_s3_vpc_flow="fl-01e52787e4495dfee"}
        | pattern `<region> <vpc_id> <az_id> <subnet_id> <instance_id> <interface_id> <flow_direction> <src_addr> <dst_addr> <src_port> <dst_port> <pkt_src_addr> <pkt_dst_addr> <pkt_src_aws_service> <pkt_dst_aws_service> <traffic_path> <packets> <bytes> <action>`
        | interface_id="eni-0352f8c82da6aa229"
        | action="ACCEPT"
        | pkt_src_addr=ip("10.0.32.0/20")
        | pkt_src_addr=~"${kubernetes_pod_ip}"
        | pkt_dst_addr=~"${remote_svc_ip}"
        | unwrap bytes
        | __error__ =""
      )[$__range]
    )
  )
)
In Options, set Type == Instant:
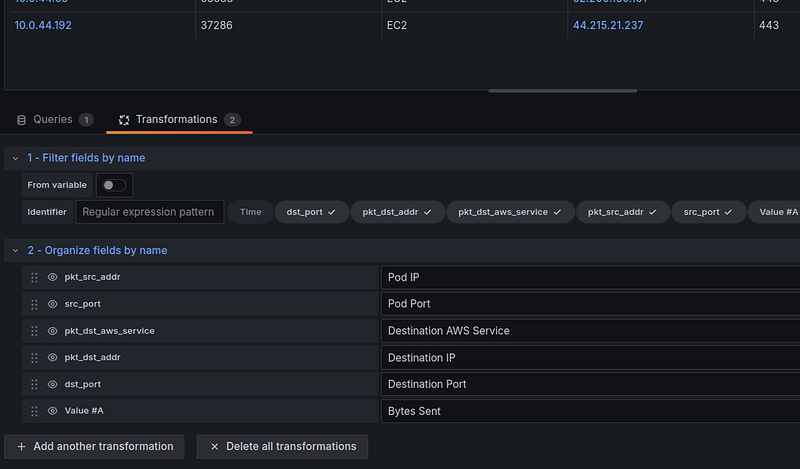
Add Transformations:
- Filter fields by name : here we remove Time
- Organize fields by name : change the column headings
The values for the Standard options > Unit and Data Links are set through the Fields override, because we will have our own parameters for each column:
Grafana dashboard: the final result
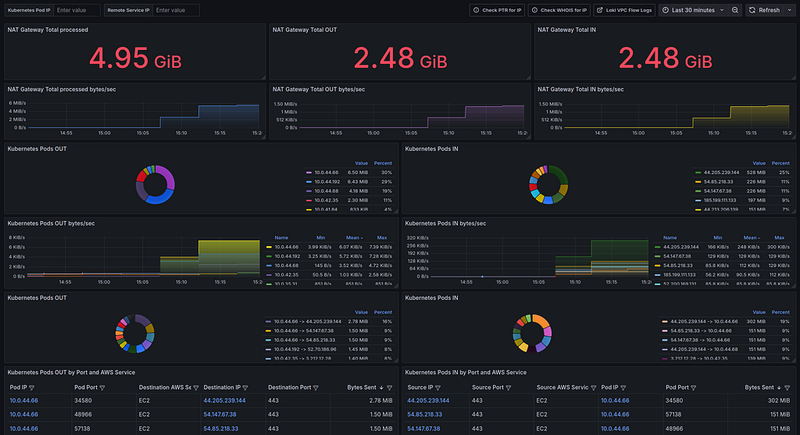
And all together now is like this:
If we don’t consider the problems with Loki’s performance when using raw logs, it seems to be working well. It’s already helped me a lot to identify unnecessary traffic, for example, a lot of traffic was coming from Athena, so we’ll add a VPC Endpoint for it so that we don’t have to send this traffic through the NAT Gateway.
Next, I’ll probably try the Recording Rules option for Loki, and I’ll definitely try writing logs to VictoriaLogs and making graphs and alerts through it.
Originally published at RTFM: Linux, DevOps, and system administration.






Top comments (0)