AWS: Cost optimization — an overview of Bills, Cost Explorer, and the costs control
Let’s continue our series on cost optimization in AWS.
Previous posts:
- AWS: cost optimization — purchasing RDS Reserved Instances
- AWS: Cost Explorer — costs checking on the CloudWatch Logs example
- AWS: Cost optimization — services expenses overview and traffic costs in AWS
Now that we understand what we pay for in AWS, let’s see what tools AWS provides to track and optimize these costs. All tools can be found here>>>>.
In this post, let’s take a look at two places to start your cost review — Bills and AWS Cost Explorer. In the next ones, we’ll touch on Trusted Advisor, Compute Optimizer, and S3 Analytics.
Note : The original post pusblished in russian in 2021, but it’s still relevant.
AWS Bills
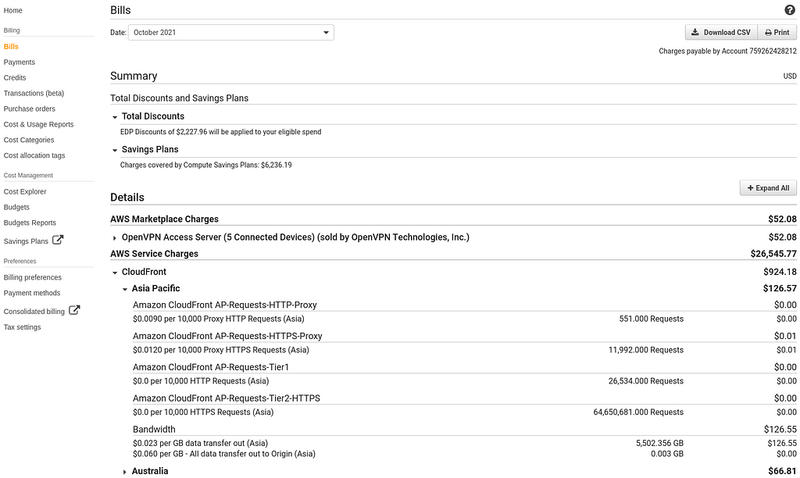
The Bills is useful in that firstly it provides details on each AWS Region, and secondly — a detailed count on the costs of each service.
Go to the Billing Management Console, select Bills on the left, select the month of interest — and get a full report on discounts and charges:
On the screenshot you can see the Compute Savings Plans discounts — we’ll look at them later, and the EDP Discounts (AWS Enterprise Discount Program — EDP) — this is a discount from AWS for our organization, as we have many projects and AWS gives us significant discounts (for example — 90% discount on CloudFront — very tasty).
Next, for each service the Bills has a detailed calculation of exactly what was billed for, broken down by region.
For example, a bill for EC2 might look like this:
Now that we have a good idea of the overall cost structure, let’s see what Cost Explorer can tell us.
AWS Cost Explorer
The Cost Explorer is probably the main tool for controlling costs.
Go to the AWS Cost Management > Cost Explorer, select a period of interest, in the Group by choose the Service, and you’ll see the main costs here:
On the chart itself we see the top 5 services we spend money on, and in the table below we can see the full list.
Cost allocation tags
A very useful thing is the Cost Allocation Tags, which allows you to categorize costs by tag in the Cost Explorer.
For example, we have Tier and Env tags. The Tier indicates a team to which a resource belongs (DevOps, Backend, QA, etc), and the Env indicates an environment (Dev, Stage, Prod).
Using them we can get statistics on the necessary groups of resources:
EC2-Instances costs with a negative value are discounts on resources, in this case these are Saving Plans.
Cost Explorer: Group by and Filters
In the Cost Explorer, we have two main tools, Group by and Filters.
For example, to see the cost detail by the EC2-Instance Type — in the Group by choose the Instance Type, and in the Filters choose the EC2-Instances:
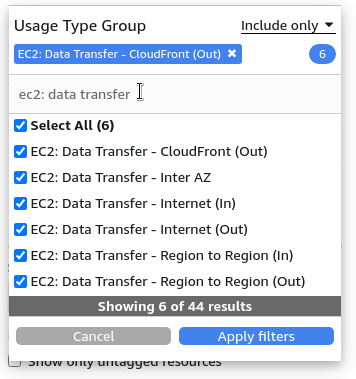
Another useful option in the Filters is the Usage Type Group, which allows you to display costs by a specific category, for example, to display a NAT Gateway data processing costs by environment
Use the Group by Tag: Env and Filters Usage Type Group: EC2: NAT Gateway — Data Processed:
For a description of all Usage Type Groups — see Filter and Group Options
AWS Resource Groups Tag editor, and the EC2 Global View
Although the Tag Editor doesn’t apply to Cost Explorer, but since we are looking for the EC2 instances costs without the Tier tag - we need to find them.
Here, the Tag Editor will be very useful, as it allows you to find resources by specified (or vice versa — not specified tags), and immediately update by adding the necessary tags to a bunch of resources.
For example, you can find all EC2s in all regions without the Tier tag like this:
Also, instances can be found through a recently introduced tool in the AWS Console — the EC2 Global View:
Cost Explorer — the traffic costs information
Now that we’ve touched on Data Transfer, let’s see how we can use Cost Explorer to check how much we pay for traffic, and for what exactly.
For example, to display information about how much traffic was transferred through EC2 instances — we can use such a filter:
Grouped by service:
Or grouped by API Operations:
Or apply in Filters a selection by Usage Type and Group By : Service:
Reports
In the Reports there is a set of pre-built reports for the Cost Explorer:
And you can save your reports with Group by , Filters and a time period, so that you don’t have to customize the sampling again next time:
Cost Explorer: what is the “EC2-other”?
Probably the most frequently asked question on AWS Cost Explorer, including by me.
Actually — what’s included in EC2-Other , and why is it so expensive? On the very first chart, it costs almost 170 dollars out of 800:
Let’s see. Select EC2-Other in Filters: and Usage type in Group by :
And you can see it right away:
-
USE2-EBS:VolumeUsage.gp2: all Elastic Block Stores created and used in us-east-2 (USE2) -
USE2-DataTransfer-Regional-Bytes: Interzone-In and Interzone-Out traffic (cross-availability zone traffic, see AWS: Cost optimization – services expenses overview and traffic costs in AWS) -
USE2-NatGateway-Bytes: NAT Gateways traffic handling -
USE2-NatGateway-Hours: NAT Gateways operating hours
The Others include other costs, for example — Elastic IP that are not connected to any instances:
To summarize, the EC2-Other includes costs for:
- EBS disks: I/O operations, and provisioned storage (how much EBS space is allocated across the account), snapshots (storage, data transfer)
- CPUCredits: surcharge for burst instances T2/3/4
- NAT Gateways: number of bytes processed, operating time in hours
- Data Transfer: Transfer data between AWS Availability Zones (cross-AZ traffic)
- Elastic IP: EIPs not connected to EC2
Useful links
- $65,589 spent on AWS in September — A full breakdown of ConvertKit’s AWS bill
- Understanding Networking Costs in AWS: Data Transfer Costs by Usage Type
- 10 things you can do today to reduce AWS costs
- Tips and Tricks for Exploring your Data in AWS Cost Explorer
- How AWS Pricing Works: AWS Pricing Overview
Originally published at RTFM: Linux, DevOps, and system administration.


Top comments (1)
AWS cost tools help you see what you are spending and why your bill changes each month. Bills and Cost Explorer show clear charts so you can track use and find waste. Cost controls help you set limits and save money before costs get too high.