0. Introduction and challenges
Practice shows that it is not enough to develop a useful application or service and deploy it in Kubernetes - you also need to be sure that they work stably.
Observability is tooling or a technical solution that allows teams to actively debug their system. Observability is based on exploring properties and patterns not defined in advance.
Such task in decentralized systems has always been difficult.
The variable and dynamic nature of workloads and resources is the fundamental reason why Kubernetes observability is so difficult. Rather than dealing with a single server, we now have to deal with an unknown number of them (due to autoscaling). We now have numerous distributed services rather than a single monolithic application. Dealing with latency, distributed transactions, errors, and other issues grew more difficult.
The greater the level of abstraction in a decentralized system, the more difficult it is to reason about, debug, and troubleshoot it.
Consider making an HTTP(s) call to an API running on a cloud provider's Kubernetes cluster. A simplified sequence diagram (drawn by Piotr Zaniewski) is shown below, with crucial parts highlighted:
🎨 A full-size image is available here.
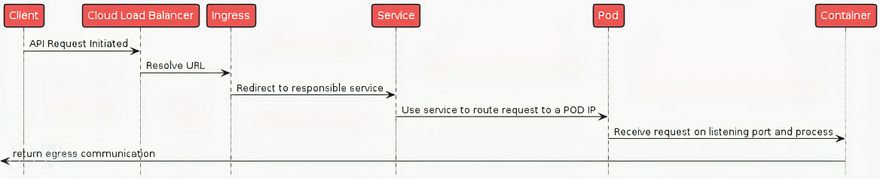
Things can go wrong at any point in this communication chain, performance can deteriorate, security issues can arise, and so on. For operational success, knowing what's going on in the cluster and having thorough insights into every step of the communication chain is critical.
And good news is that we have Pixie, another great CNCF project, for this observability task today!
I. Why Pixie is a fast and precise tool
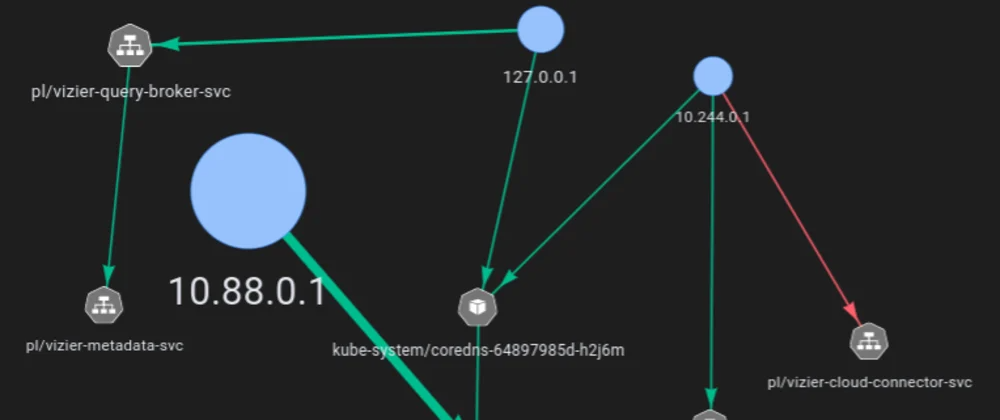
Pixie is an open source (3.4k⭐) observability platform built by New Relic. It is very convenient to use Pixie to view the high-level state of your cluster (service maps, cluster resources, application traffic) and also drill down into more detailed views (pod state, flame graphs, individual full-body application requests).
Pixie uses eBPF, which stands for extended Berkeley Packet Filter, to automatically collect telemetry data such as full-body requests, resource and network metrics, application profiles, and more.
It collects, stores and queries all telemetry data locally in the cluster. Providing a granular level of observability is possible thanks to eBPF that makes the kernel programmable in a safe and performant way.
Rather than relying on gauges and static counters exposed by the operating system, eBPF allows for the generation of visibility events and the collection and in-kernel aggregation of custom metrics based on a broad range of potential sources.
Let’s take a look at how this works for application request tracing.
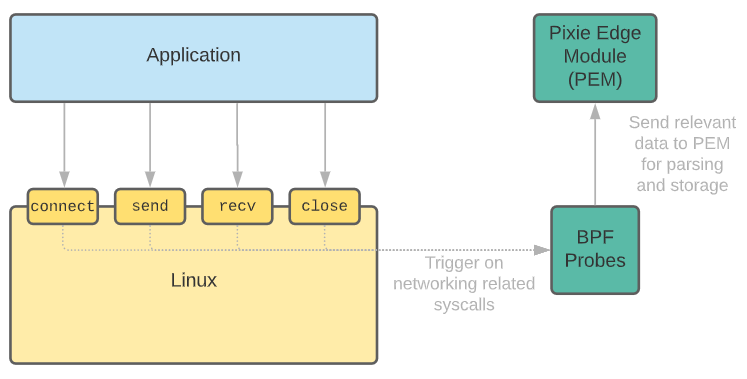
When Pixie is deployed to the nodes in your cluster, it deploys eBPF kernel probes that are set up to trigger on the Linux syscalls used for networking. When your application makes any network-related syscalls -- such as send() and recv() -- Pixie's eBPF probes snoop the data and send it to Pixie’s edge module (PEM, an agent).
The edge module parses the data according to the detected protocol and stores the data in tables locally on the node. Looking ahead, can be mentioned that these data tables can then be queried and visualized using the Pixie API, CLI or web-based UI.
Btw, for your attention, CNCF's Liz Rice has told interesting things about eBPF's advantages which are meaningful in our cloud field.
This increases the depth of visibility that might be attained and decreases the overall system overhead dramatically. This is achieved by collecting only the required visibility data and by producing histograms and similar data structures at the source of the event, rather than depending on the export of samples.
Pixie supports EKS, GKE and AKS. The tool is modest on resources, it uses less than 5% of cluster CPU, and in most cases even less than 2%.
II. Does it work with a local cluster?
🚦 The short answer is "Yes". For local development, creators recommend using Minikube with a VM driver (kvm2 in Linux, Kernel-based Virtual Machine driver). Unfortunately for the article's author, K3s/K3d clusters are not well-supported by Pixie.
Well, we'll start with this: install Minikube, launch a cluster and deploy in it something [painfully familiar, but] popular. More on that below.
Installing Minikube on Ubuntu
⚠️ To use VM drivers, verify that your system has virtualization support enabled:
egrep -q 'vmx|svm' /proc/cpuinfo && echo yes || echo no
If the above command outputs no, ensure that your BIOS has hardware virtualization enabled.
Proper installation of KVM (and libvirt which is among the requirements) are highly specific to each Linux distribution. It is mandatory to have 2 virtual CPUs or more, at least 2 GB of free memory and enough of free disk space. You may find Ubuntu related instructions here. Some author's notes may be useful on it.
You need to ensure that your username is added to libvirt and kvm groups!
$ sudo adduser `id -un` libvirt
Adding user '<username>' to group 'libvirt' ...
$ sudo adduser `id -un` kvm
Adding user '<username>' to group 'kvm' ...
Do not forget to enable and start libvirt daemon:
$ sudo systemctl enable libvirtd
$ sudo systemctl start libvirtd
To make kvm2 the default driver:
$ minikube config set driver kvm2
Start Minikube:
$ minikube start --driver=kvm2 --cni=flannel --cpus=2 --memory=4000 -p=pixie-cluster
☺️  [pixie-cluster] minikube v1.25.2 on Linuxmint 20.2
✨  Using the kvm2 driver based on user configuration
💾  Downloading driver docker-machine-driver-kvm2:
    > docker-machine-driver-kvm2-...: 65 B / 65 B [----------] 100.00% ? p/s 0s
    > docker-machine-driver-kvm2-...: 11.62 MiB / 11.62 MiB  100.00% 24.49 MiB
💿  Downloading VM boot image ...
    > minikube-v1.25.2.iso.sha256: 65 B / 65 B [-------------] 100.00% ? p/s 0s
    > minikube-v1.25.2.iso: 237.06 MiB / 237.06 MiB  100.00% 34.47 MiB p/s 7.1s
👍  Starting control plane node pixie-cluster in cluster pixie-cluster
🔥  Creating kvm2 VM (CPUs=2, Memory=4000MB, Disk=20000MB) ...
🐋  Preparing Kubernetes v1.23.3 on Docker 20.10.12 ...
    ▪️ kubelet.housekeeping-interval=5m
    ▪️ Generating certificates and keys ...
    ▪️ Booting up control plane ...
    ▪️ Configuring RBAC rules ...
🔗  Configuring Flannel (Container Networking Interface) ...
🔎  Verifying Kubernetes components...
    ▪️ Using image gcr.io/k8s-minikube/storage-provisioner:v5
🌟  Enabled addons: storage-provisioner, default-storageclass
🏄  Done! kubectl is now configured to use "pixie-cluster" cluster and "default" namespace by default
A cluster name followed by -p is not mandatory. Set for convenience, but if set, it is used everywhere.
⚠️ If you're getting socket permission error
Failed to connect socket to '/var/run/libvirt/libvirt-sock'
try to reboot so the new group libvirt was actually visible for my user. You can achieve the same without rebooting by running
$ exec sudo su -l $USER
III. Deploying Pixie
☁️ Web UI is hosted in the cloud. Visit product page and sign up to obtain API key which will allow you to use Pixie.
Pixie's CLI is the fastest and easiest way to deploy Pixie. You can also deploy Pixie using YAML or Helm. You can use these steps to install Pixie to one or more clusters.
To deploy Pixie using the CLI:
# Deploy the Pixie Platform in your K8s cluster (No OLM present on cluster).
px deploy
# Deploy the Pixie Platform in your K8s cluster (OLM already exists on cluster).
px deploy --deploy_olm=false
# Deploy Pixie with a specific memory limit (2Gi is the default, 1Gi is the minimum recommended)
px deploy --pem_memory_limit=1Gi
Let's see what Pixie's deployment flow outputs.
$ px deploy --pem_memory_limit=1Gi
Pixie CLI
Running Cluster Checks:
 ✔️    Kernel version > 4.14.0
 ✔️    Cluster type is supported
 ✔️    K8s version > 1.16.0
 ✔️    Kubectl > 1.10.0 is present
 ✔️    User can create namespace
 ✔️    Cluster type is in list of known supported types
Installing Vizier version: 0.11.1
Generating YAMLs for Pixie
Deploying Pixie to the following cluster: pixie-cluster
Is the cluster correct? (y/n) [y] : y
Found 1 nodes
 ✔️    Installing OLM CRDs
 ✔️    Deploying OLM
 ✔️    Deploying Pixie OLM Namespace
 ✔️    Installing Vizier CRD
 ✔️    Deploying OLM Catalog
 ✔️    Deploying OLM Subscription
 ✔️    Creating namespace
 ✔️    Deploying Vizier
 ✔️    Waiting for Cloud Connector to come online
Waiting for Pixie to pass healthcheck
 ✔️    Wait for PEMs/Kelvin
 ⠇    Wait for healthcheck
 ✔️    Wait for PEMs/Kelvin
 ✔️    Wait for healthcheck
==> Next Steps:
Run some scripts using the px cli. For example:
- px script list : to show pre-installed scripts.
- px run px/service_stats : to run service info for sock-shop demo application (service selection coming soon!).
Check out our docs: https://docs.withpixie.ai:443.
Visit : https://work.withpixie.ai:443 to use Pixie's UI.
IV. Prepare the payload
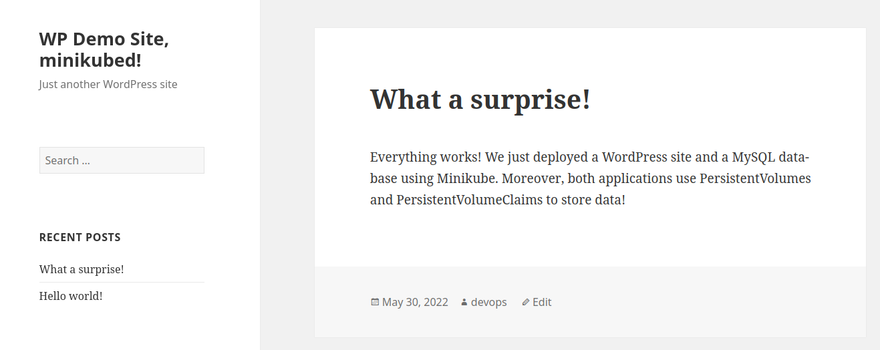
As a payload and for greater proximity to the people, the author suggests deploying a WordPress site and a MySQL database. Both applications use PersistentVolumes and PersistentVolumeClaims to store data.
🐘 You may decrease storage: 20Gi value in YAMLs down to 2Gi, for example.
Verify that PVs are provisioned and bound (it can take up to a few minutes) and pods are running. Then run the following command to get the IP Address for the WordPress Service:
$ kubectl get svc
NAME              TYPE           CLUSTER-IP     EXTERNAL-IP   PORT(S)        AGE
kubernetes        ClusterIP      10.96.0.1      <none>        443/TCP        14h
wordpress         LoadBalancer   10.105.33.77   <pending>     80:30140/TCP   5h31m
wordpress-mysql   ClusterIP      None           <none>        3306/TCP       5h31m
⚠️ Minikube can only expose Services through NodePort. The EXTERNAL-IP is always pending.
$ minikube service wordpress --url -p=pixie-cluster
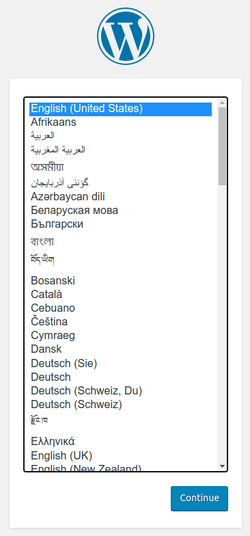
Copy the IP address (i.e.http://192.168.39.74:30140) and load the page in your browser to view your site.
You should see the WordPress set up page similar to the following screenshot:
⚠️ Do not leave your WordPress installation on this page.
Proceed with WordPress installation as usual - by creating a username and password, updating plugins and themes etc. Thus, it will be possible to accumulate a database of requests and traffic for analysis. Refreshing the page in the browser (with F5 key) helps with this, too.
V. Pixie's web UI basic concepts
The interface can be conditionally divided into
- a main dropdown menu containing
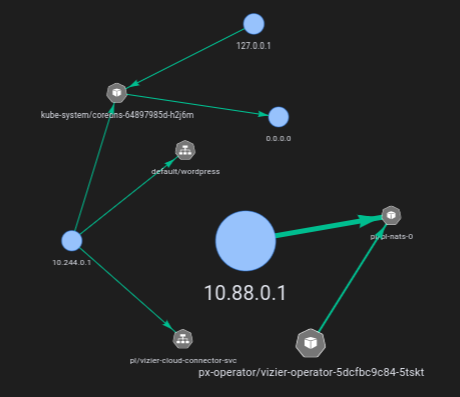
px scriptto execute, - a panel for visualizing services in a cluster,
- reporting and logging panels,
- a hidden information panel that saves screen space and slides up, and
- a sidebar menu.
The general view will be something like this:
🎨 A full-size image is available here.
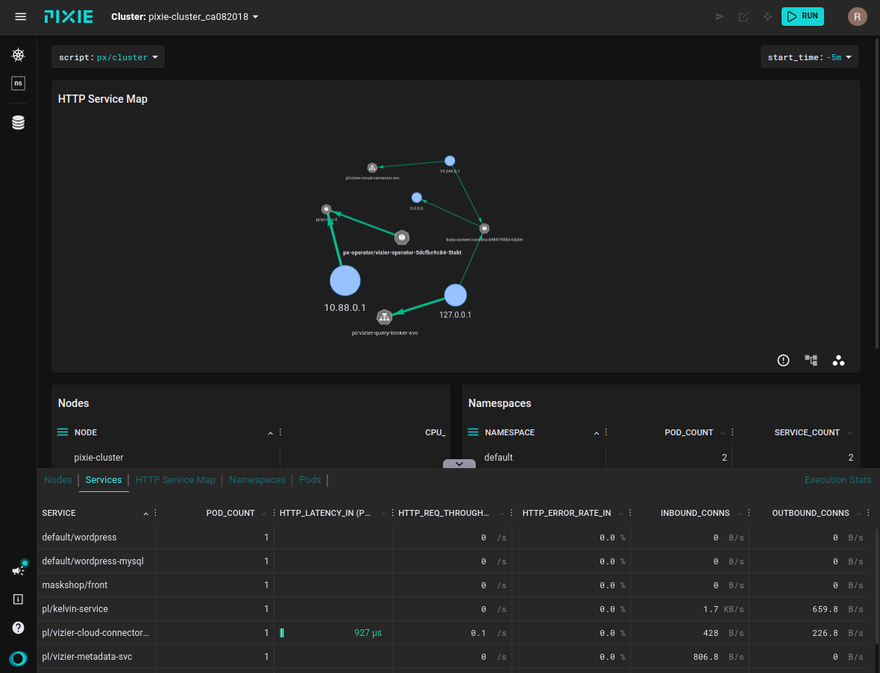
Elements in the service visualization panel (top) can be dragged, and you can also use the mouse wheel to zoom.
In fact, the entire web UI is a display of the scripts' output with various parameters and objects within the cluster.
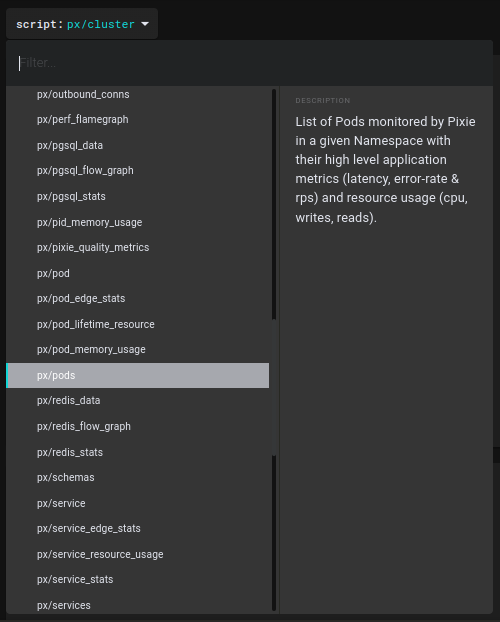
VI. List of scripts
$ px script list
Pixie CLI
Table ID: script_list
  NAME                                DESCRIPTION
  bpftrace/capable                    Capable
  bpftrace/dc_snoop                   DC Snoop
  bpftrace/exec_snoop                 Exec Snoop
  bpftrace/md_flush                   MD Flush
  bpftrace/nap_time                   NAP Time
  bpftrace/oom_kill                   OOM Killer
  bpftrace/sync_snoop                 Sync Snoop
  bpftrace/tcp_drops                  TCP drops
  bpftrace/tcp_retransmits            TCP retransmissions
  px/agent_status                     Get agent status.
  px/cluster                          Cluster Overview
  px/cql_data                         Sample CQL Data
  px/cql_stats                        CQL Pod LET metrics
  px/dns_data                         Raw DNS Data
  px/dns_flow_graph                   DNS Flow Graph
  px/dns_query_summary                DNS Queries Overview
  px/funcs                            Get a list all of all funcs available in Pixie.
  px/http_data                        HTTP Data
  px/http_data_filtered               Sample HTTP Data
  px/http_post_requests               Sample HTTP POST Data
  px/http_request_stats               HTTP Requests Statistics by Service
  px/inbound_conns                    Inbound Connections
  px/ip                               Traffic to/from IP
  px/jvm_data                         JVM stats
  px/jvm_stats                        JVM Stats per Pod
  px/kafka_consumer_rebalancing       Kafka Consumer Rebalancing Events
  px/kafka_data                       Kafka messages
  px/kafka_overview                   Kafka Overview
  px/kafka_producer_consumer_latency  Kafka producer-consumer latency
  px/largest_http_request             Largest HTTP Request
  px/most_http_data                   Pod, Endpoint pair with most HTTP Data Transferred
  px/mysql_data                       MySQL Data
  px/mysql_flow_graph                 MySQL Flow Graph
  px/mysql_stats                      MySQL Pod LET metrics
  px/namespace                        Namespace Overview
  px/namespaces                       Namespaces Overview
  px/nats_data                        NATS data
  px/net_flow_graph                   Network Flow
  px/network_stats                    Network Stats
  px/node                             Node overview
  px/nodes                            Nodes overview
  px/outbound_conns                   Outbound Connections
  px/perf_flamegraph                  Flamegraph
  px/pgsql_data                       Postgres Data
  px/pgsql_flow_graph                 PostgreSQL Flow Graph
  px/pgsql_stats                      PostgreSQL Pod LET metrics
  px/pid_memory_usage                 Memory Usage of Processes.
  px/pixie_quality_metrics            Metrics that sample Pixie's collectors
  px/pod                              Pod Overview
  px/pod_edge_stats                   Pod to Pod SLAs
  px/pod_lifetime_resource            Total resource usage over pod lifetime.
  px/pod_memory_usage                 Memory Usage of Processes
  px/pods                             Pods Overview
  px/redis_data                       Redis RPC messages
  px/redis_flow_graph                 Redis Flow Graph
  px/redis_stats                      Redis Pod LET metrics
  px/schemas                          Get all the table schemas available in the system
  px/service                          Service Overview
  px/service_edge_stats               Basic Service to Service SLAs
  px/service_resource_usage           Resource Usage of Services.
  px/service_stats                    Basic service SLAs.
  px/services                         Services Overview
  px/slow_http_requests               Sample of Slow Requests
  px/sql_queries                      Normalized SQL Queries
  px/sql_query                        SQL Query Params
  px/tcp_drops                        TCP drops
  px/tcp_retransmits                  TCP retransmissions
  px/tracepoint_status                Tracepoint Overview
  px/upids                            UPIDs
  pxbeta/pii_cluster_egress           Traffic containing PII leaving the cluster
  pxbeta/service_endpoint             Endpoint Overview
  pxbeta/service_endpoints            Endpoints Overview
  pxbeta/vfs_snoop                    VFS Write/Delete Snoop
  sotw/dns_external_fqdn_list         Lists external FQDNs from DNS traffic.
  sotw/dns_queries_filtered           All DNS queries filtered by a specific query nameTTP Data
  px/http_data_filtered               Sample HTTP Data
  px/http_post_requests               Sample HTTP POST Data
  px/http_request_stats               HTTP Requests Statistics by Service
  px/inbound_conns                    Inbound Connections
  px/ip                               Traffic to/from IP
  px/jvm_data                         JVM stats
  px/jvm_stats                        JVM Stats per Pod
  px/kafka_consumer_rebalancing       Kafka Consumer Rebalancing Events
  px/kafka_data                       Kafka messages
  px/kafka_overview                   Kafka Overview
  px/kafka_producer_consumer_latency  Kafka producer-consumer latency
  px/largest_http_request             Largest HTTP Request
  px/most_http_data                   Pod, Endpoint pair with most HTTP Data Transferred
  px/mysql_data                       MySQL Data
  px/mysql_flow_graph                 MySQL Flow Graph
  px/mysql_stats                      MySQL Pod LET metrics
  px/namespace                        Namespace Overview
  px/namespaces                       Namespaces Overview
  px/nats_data                        NATS data
  px/net_flow_graph                   Network Flow
  px/network_stats                    Network Stats
  px/node                             Node overview
  px/nodes                            Nodes overview
  px/outbound_conns                   Outbound Connections
  px/perf_flamegraph                  Flamegraph
  px/pgsql_data                       Postgres Data
  px/pgsql_flow_graph                 PostgreSQL Flow Graph
  px/pgsql_stats                      PostgreSQL Pod LET metrics
  px/pid_memory_usage                 Memory Usage of Processes.
  px/pixie_quality_metrics            Metrics that sample Pixie's collectors
  px/pod                              Pod Overview
  px/pod_edge_stats                   Pod to Pod SLAs
  px/pod_lifetime_resource            Total resource usage over pod lifetime.
  px/pod_memory_usage                 Memory Usage of Processes
  px/pods                             Pods Overview
  px/redis_data                       Redis RPC messages
  px/redis_flow_graph                 Redis Flow Graph
  px/redis_stats                      Redis Pod LET metrics
  px/schemas                          Get all the table schemas available in the system
  px/service                          Service Overview
  px/service_edge_stats               Basic Service to Service SLAs
  px/service_resource_usage           Resource Usage of Services.
  px/service_stats                    Basic service SLAs.
  px/services                         Services Overview
  px/slow_http_requests               Sample of Slow Requests
  px/sql_queries                      Normalized SQL Queries
  px/sql_query                        SQL Query Params
  px/tcp_drops                        TCP drops
  px/tcp_retransmits                  TCP retransmissions
  px/tracepoint_status                Tracepoint Overview
  px/upids                            UPIDs
  pxbeta/pii_cluster_egress           Traffic containing PII leaving the cluster
  pxbeta/service_endpoint             Endpoint Overview
  pxbeta/service_endpoints            Endpoints Overview
  pxbeta/vfs_snoop                    VFS Write/Delete Snoop
  sotw/dns_external_fqdn_list         Lists external FQDNs from DNS traffic.
  sotw/dns_queries_filtered           All DNS queries filtered by a specific query name
VII. How about practice? Popular queries
With Pixie, observability may include:
- 🐞 full-body application HTTP requests,
- 🐞 application profiles,
- 🐞 network health metrics,
- 🐞 infrastructure health metrics,
- 🐞 database query profiles.
🐞 Full-body HTTP request
The involved sripts are px/http_data_filtered and `px/http_request_stats.
🎨 A full-size image is available here.
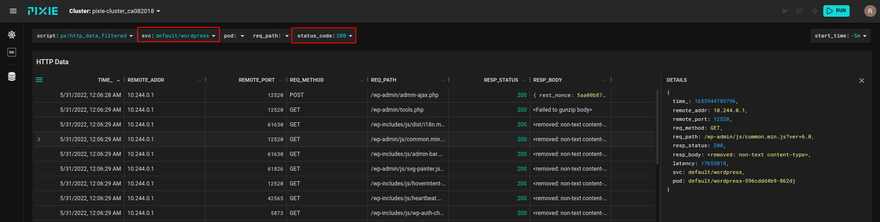
💡 Substituting HTTP error codes such as 500 you may investigate problematic services or pods.
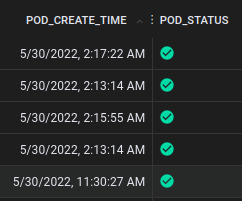
🐞 Application profiles
The involved scripts are px/namespace and px/pod.
🐞 Network health metrics
The involved scripts are px/net_flow_graph, px/dns_flow_graph, px/tcp_drops.
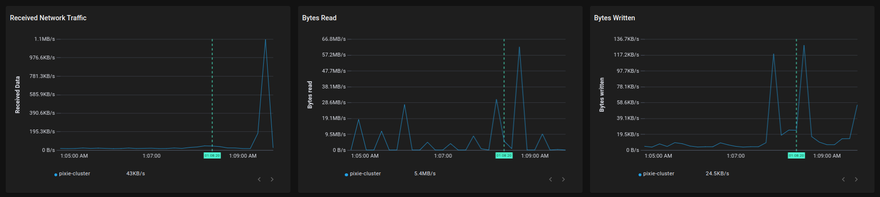
🐞 Infra health metrics
The involved scripts is px/nodes.
🎨 A full-size image is available here.
🐞 Database query profiles
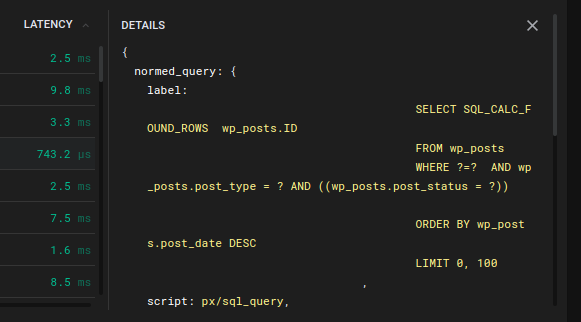
The involved scripts are px/mysql_stats and px/sql_queries.
🎨 A full-size image is available here.
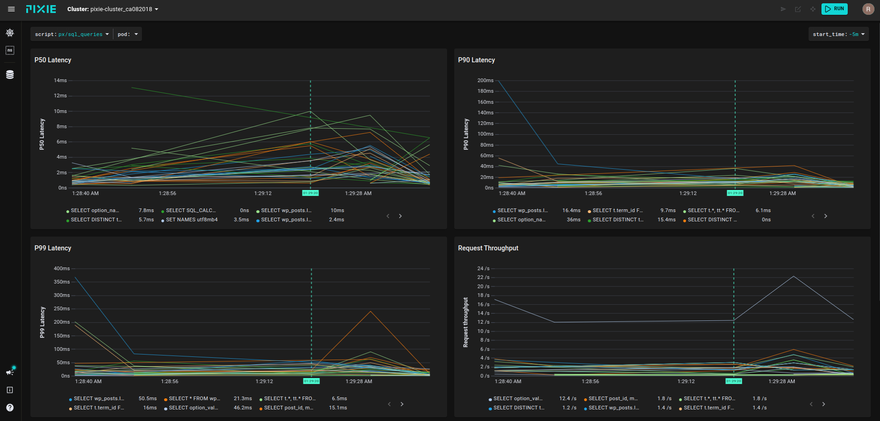
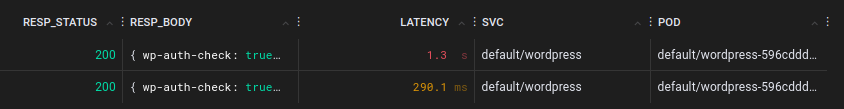
Query latencies are visible at a glance, too:
Based on these data, you can think further, to optimize the operation of the DBMS, but this is a completely different story that goes beyond the scope of this article.
VII. Conclusion
Pixie is one of a handful of observability tools that offer eBPF or kernel-level observability. Other ones are Cilium, see author's previous article, and CVF.

With a single CLI command, developers are able to see all of their applications’ metrics, events, logs, and traces. Pixie’s technology removes the need to add instrumentation code, set up ad hoc dashboards, or move data off of the cluster, saving developers valuable time so they can focus instead on building better software.
Skip the code changes and get instant Kubernetes observability! Good luck.

Oldest comments (0)