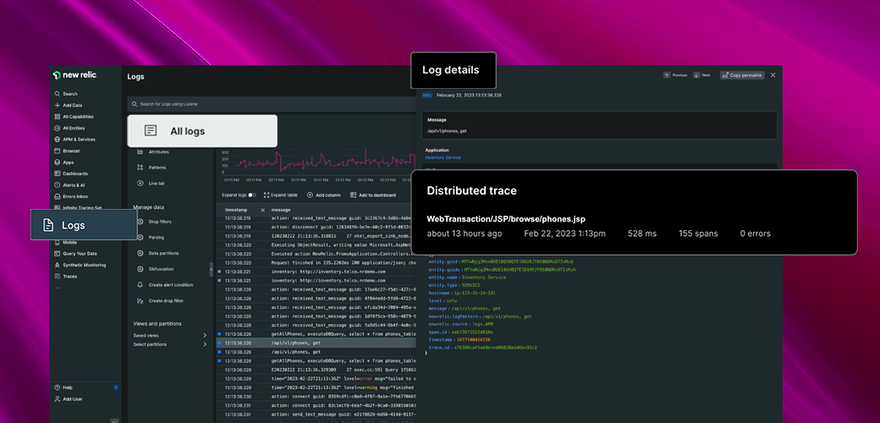
Resolve issues faster with traces in errors inbox, APM errors, and logs
Quickly find the traces you need with distributed traces in errors inbox, APM errors, and logs for real-time, full-visibility and faster troubleshooting. Check out our blog for more information on how to get started with traces in context.
Get Started
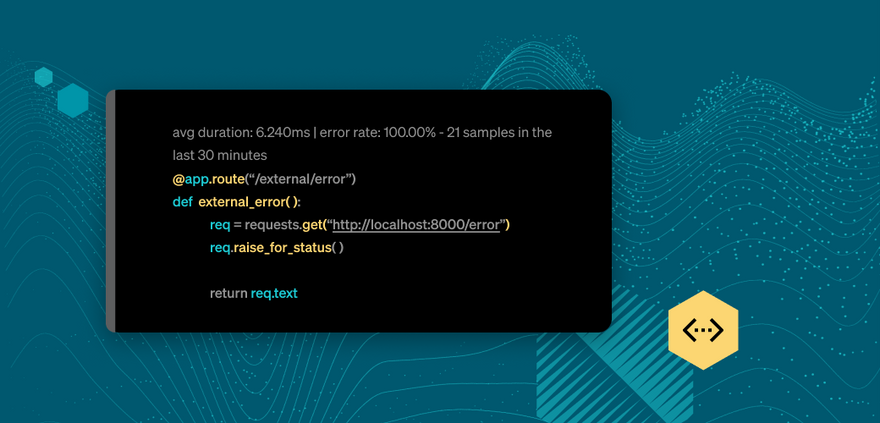
Integrate observability into your developer workflows with code-level metrics
Now available for all agents, you can now access telemetry data in the IDE at the service level all the way down to lines of code. Get ahead of issues before they hit production, speed your dev cycles, and push out better code with CodeStream.
Learn More
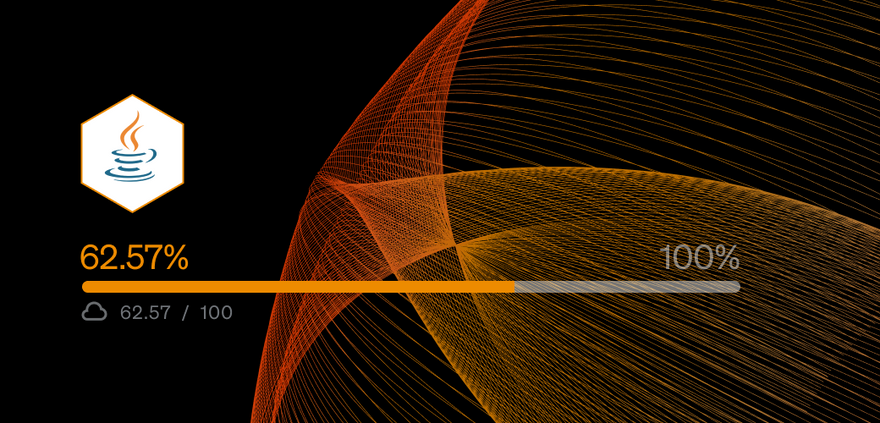
New language versions and frameworks support
New Relic agents are constantly updated to support new frameworks and language versions as they emerge. Check out the latest language versions and frameworks support, like our Java agent’s new support for Jakarta EE 9/9.1 instrumentation and Java SE 19!

Top five observability pricing traps
Learn about five common observability pricing and billing traps—including unbudgeted monthly overage fees and penalties, and paying for the whole month or year at your peak usage level—and how to avoid them. Learn More
Making the switch to New Relic from Sumo Logic after private equity acquisition
Private equity acquisitions like this can lead to uncertainty and questions. Learn how switching from Sumo Logic to New Relic can help you get unified capabilities, data, and teams with simple, transparent pricing. Learn More
Part 3 in our Monitoring Kubernetes series is live!
In the latest part in our series, New Relic Principal DevRel Engineer Daniel Kim shares tips for identifying and troubleshooting some common errors at the container, pod, and node level to help your clusters run smoothly. Learn More

Webinar: Get Started with New Relic
Join us each week for our series of public webinars. Whether you’re just discovering observability, you’re a new user on the platform, or you simply have questions – we have a session for you. Register Now

Manage your Confluent Cloud Metrics API with Prometheus remote write
The New Relic OpenTelemetry collector is the most optimal way to monitor your Confluent kafka cluster. However, if you don’t want to install a Go client or set up a collector, a Prometheus container can be used to scrape Confluent Cloud Metrics API and remote write to New Relic. This solution allows you to create custom dashboards via the New Relic UI and eliminates storage concerns. Learn More
Join the New Relic Slack community to continue the conversation with hundreds of other developers using New Relic. 🌎
Not an existing New Relic user? Sign up for a free account to get started! 👨💻

Latest comments (0)