
Here’s the scoop on the latest New Relic product innovations, partnerships, and events:
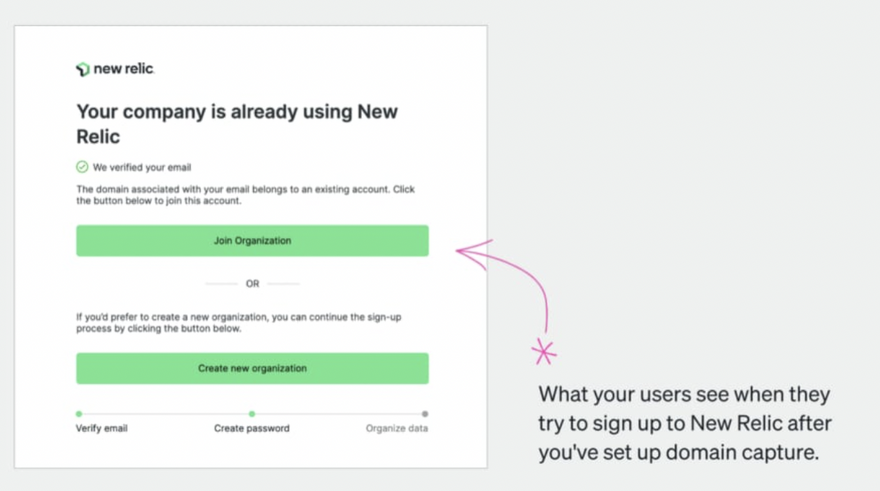
Connect new users across your organization with domain capture
Register your domain(s) to automatically add new signups with the same verified email domain to your organization’s New Relic account. This simplifies user provisioning for administrators, while providing new users with seamless access to their role-specific data. Check out our docs page to learn how to enable domain capture today. Learn More
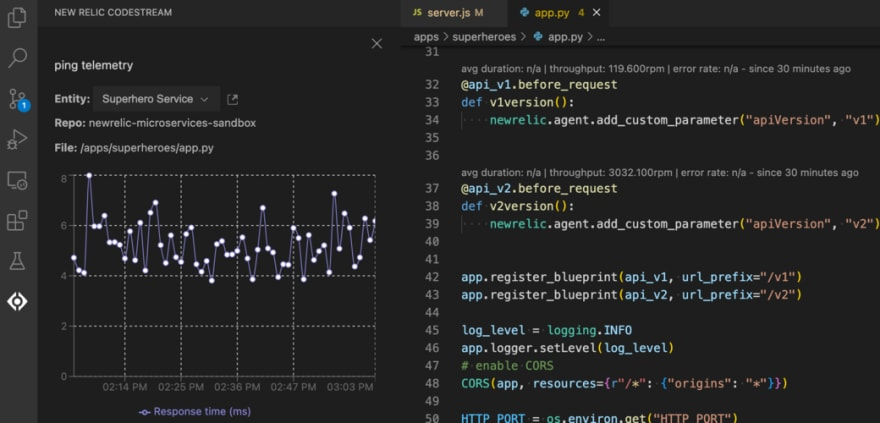
.NET engineers: Access golden signals in your IDE today
Our latest agent update allows you to access the latest observability features, like golden signals visible down to the method level, when you update your .NET agent to v.9.9.0 and above. Check out our demo and blog to learn more. New to CodeStream? Learn more about New Relic CodeStream here.
Update Your .Net Agent
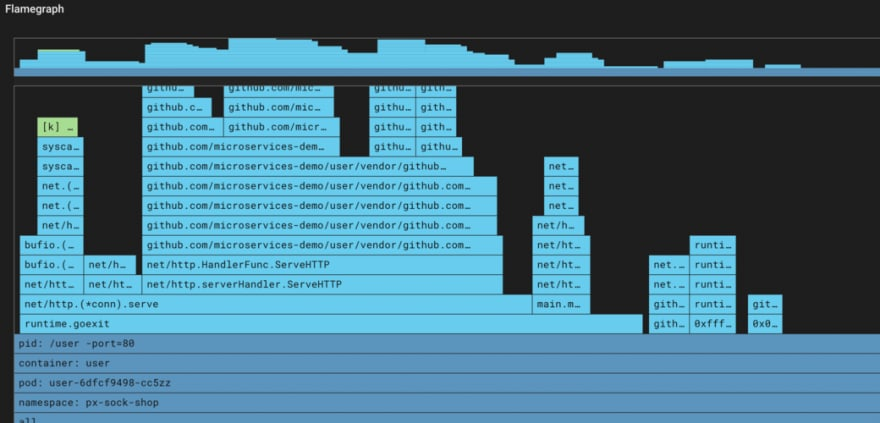
Visualize Java application CPU usage with our new flamegraph in Pixie tool
Understand where your Java application is spending its CPU time and understand why CPU utilization increased with your new release. Use this tool continuously in production for a minimally invasive, ultra-low overhead (< 0.1%) profiler that does not require redeploys. Start by deploying Pixie, select a pod from the Kubernetes cluster explorer, then select the Check flamegraph in Pixie option. Learn More
Run Pixie in smaller clusters with new low memory mode
We’ve reduced Pixie’s memory requirements by 50%, dropping its minimum memory requirement down to only 1 GB. Systems with as little as 4 GB of total memory can now run Pixie. Head to our docs to learn how to manage the memory used by Pixie.
Get Started
Read the 2022 Observability Forecast report
The 2022 Observability Forecast report features insights into the current use of observability tools and approaches, as well as perspectives on the future of observability from the largest survey sample of its kind. Read Report
Monitor your CDN performance in minutes with quickstart integrations
Keep tabs on performance metrics such as load balancing, latency, availability, and more in the context of all your telemetry data. Our quickstarts from leading content delivery network (CDN) providers Akamai, Cloudflare, and Fastly help you get started in minutes with integration instructions, pre-built dashboards, and alerts. Learn More
End of Life Announcements: New TLS standard requirements
As part of our commitment to security and evolving regulatory Transport Layer Security (TLS) standards, we are updating our TLS requirements for all inbound connections to a minimum version of 1.2 or above, effective October 24, 2022. Read more about this update on this Explorers Hub post, and leave a comment with any questions or concerns.
Learn More
Support Tip of the Week: Scaling and rightsizing the CPM
Containerized private minions (CPM) are Docker container-based private minions that accept and execute synthetic monitors against your private locations. CPM can help you monitor almost anything you can imagine. In this article, we review the key considerations for scaling your CPM. Learn More
Join New Relic’s Slack community to continue the conversation with hundreds of other developers using New Relic.
Not an existing New Relic user? Sign up for a free account to get started!

Top comments (0)