
Here’s the scoop on the latest New Relic product innovations, partnerships, and events:
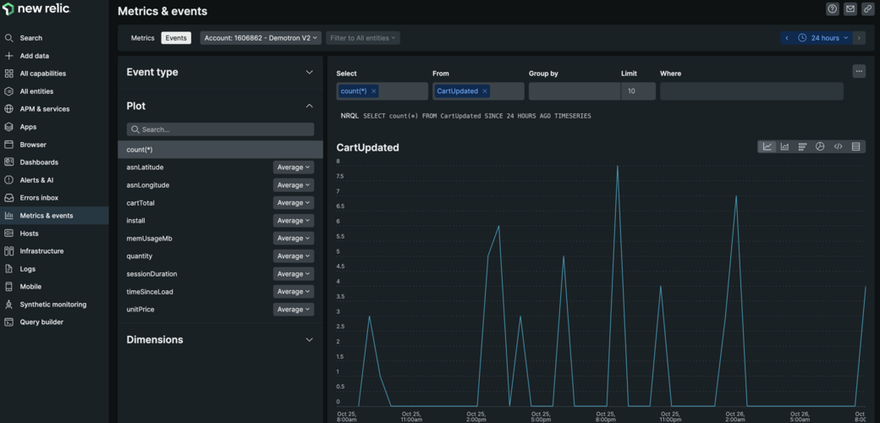
Get more custom events with the our latest APM agent update
We’ve released a new update for application performance monitoring (APM) language agents that increases the default and maximum limit for custom events. You can now ingest more custom events to track critical actions for analysis and troubleshooting.
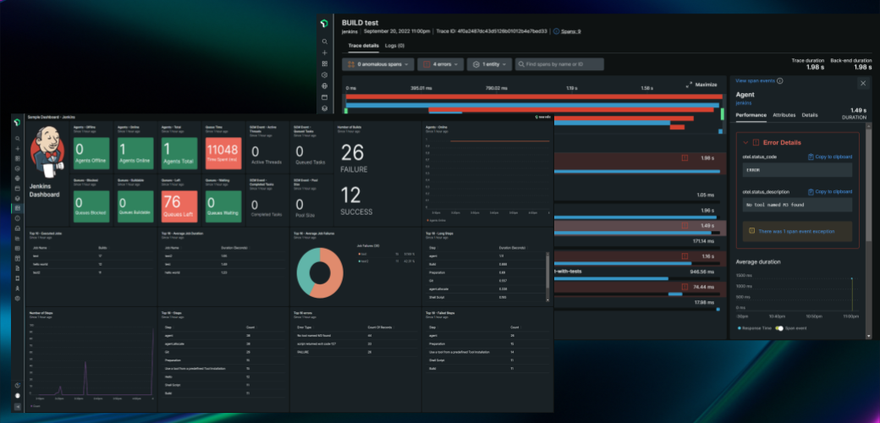
Get instant observability into your Jenkins pipelines
Monitor your Jenkins continuous integration/continuous delivery (CI/CD) pipeline health in minutes with our Jenkins with OpenTelemetry integration! Watch the demo to learn how to get job and pipeline executions as distributed traces. Then install the quickstart to get a dashboard with all your metrics in one place.
Support tip of the week: Troubleshoot network issues with .NET agent
If you’re using the .NET agent and data is not reporting, you may see an error like this: “ERROR: Unable to connect to the New Relic service at collector.newrelic.com:443.” We provide the steps you need to troubleshoot and resolve these network issues in this article.
What's new at New Relic
Learn more about these new features and the rest of our latest releases by checking out What's new.
Join the New Relic Slack community to continue the conversation with hundreds of other developers using New Relic.
Not an existing New Relic user? Sign up for a free account to get started!

Latest comments (0)