Here’s the scoop on the latest New Relic product innovations, partnerships, and events:
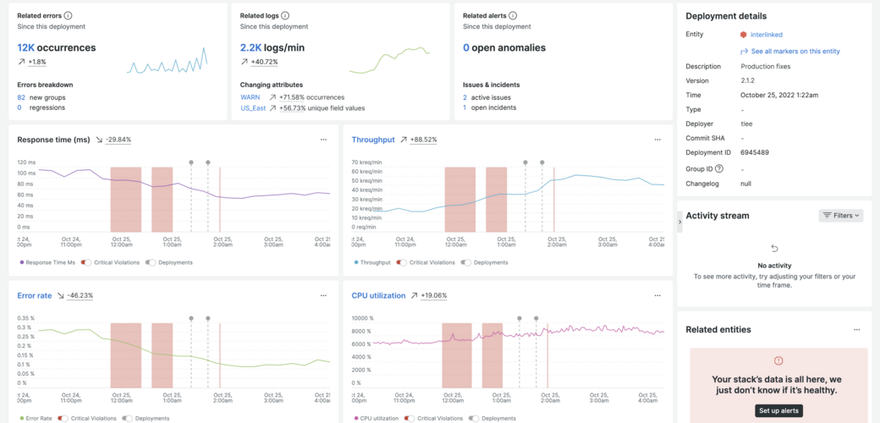
Gain context with full-stack deployment and change tracking
Change tracking marks changes and deployments alongside performance data. Quickly understand the impact of changes, why they were made, and who made them. Request access to the limited preview today!
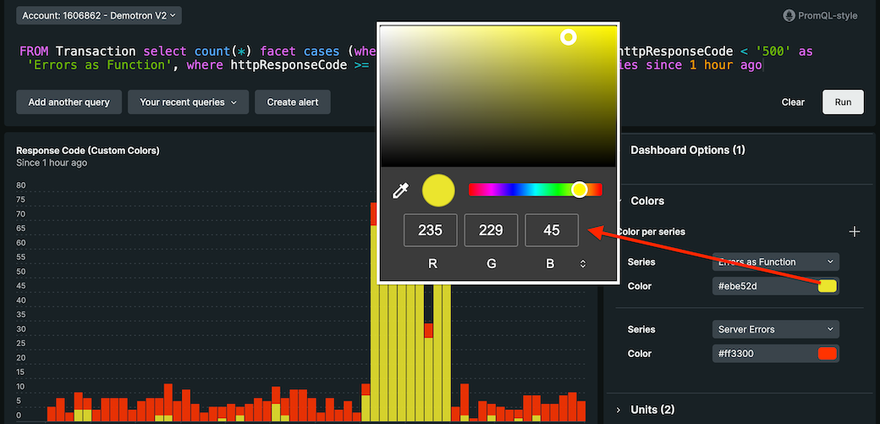
Steal this dashboard and explore new chart customizations
New features have arrived to help you enhance your dashboards with more clarity, richer content, and flexibility. Plus, we’ve put them all in an interactive dashboard template so that you can test it out in minutes. Check out our two demo videos to help you get started: —with Enhance your New Relic dashboards with markdown, New Chart Customization Features (Interactive Demo).
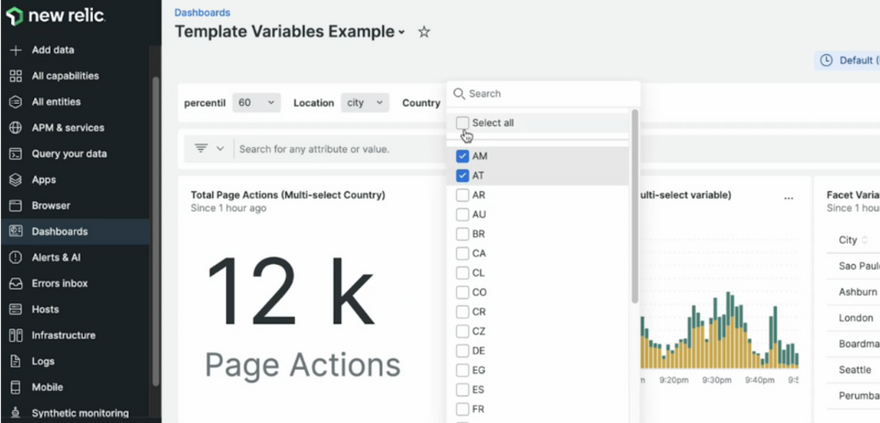
Build dynamic New Relic dashboards with template variables
Template variables for New Relic dashboards are placeholders in the New Relic query language (NRQL) queries that can be assigned different values depending on the use case. They enable users to quickly and easily filter through a dashboard for more precise data insights.
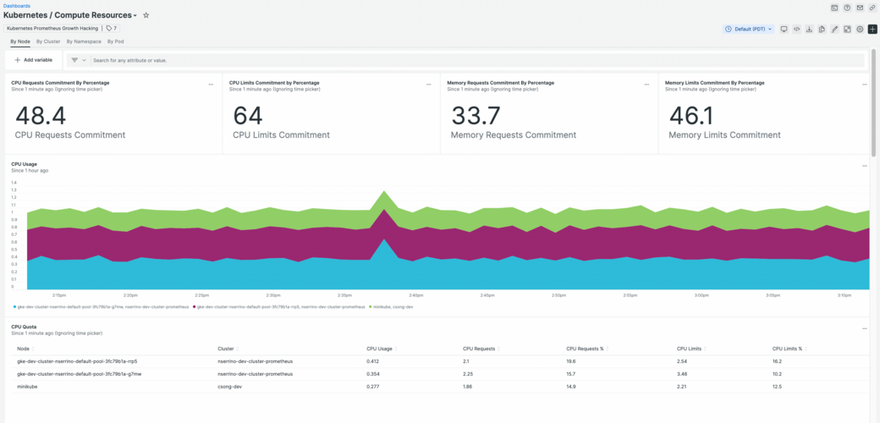
Get full observability of your clusters with our new Prometheus solution
We’ve made it easier to understand the performance of your Kubernetes clusters and services! Correlate Prometheus metrics alongside the rest of your observability data effortlessly with our new agent and pre-built dashboards and alerts.
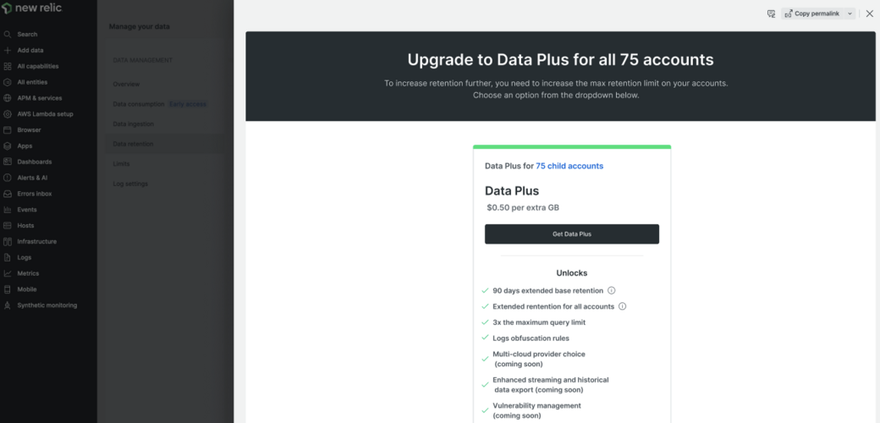
Extend your data retention in-product for compliance and longer-term analysis
We’ve made it easier for you to extend data retention or sign up for Data Plus within the product. This allows you to better maintain compliance, perform long-term data analysis, and enhance your observability practices.
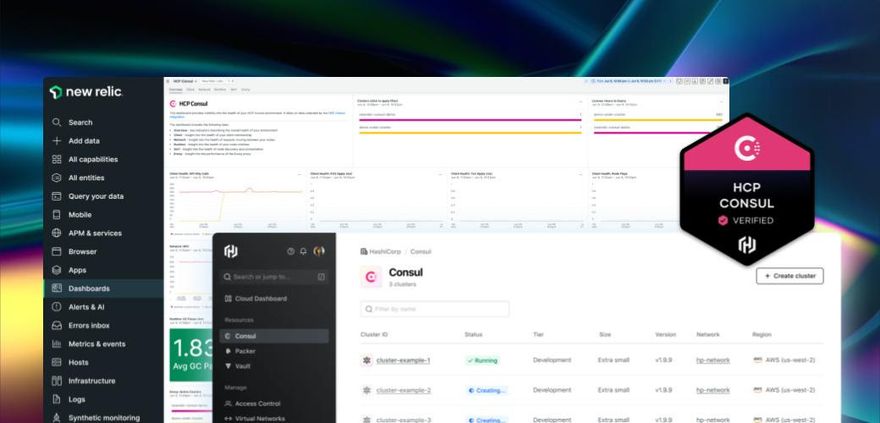
Quickstart highlight: HCP Consul
Keep your clusters healthy and your mesh services operating at full capacity with the HCP Consul quickstart. It includes a pre-made dashboard for insight into metrics across your client members, network, runtime, nodes, and more.
End-of-life announcements: New TLS standard requirements
As part of our commitment to security and evolving regulatory Transport Layer Security (TLS) standards, we are updating our TLS requirements for all inbound connections to version 1.2 or above on February 1, 2023. Want to know more, ask a question, or leave a comment? Check out this Explorers Hub post.
Useful reads
The second part of our Monitoring Kubernetes Guide is now available!
We’ve put together a multi-part series on monitoring Kubernetes for total infrastructure observability. Parts one and two are available now, and more will be coming in the future:
How to Monitor Kubernetes, Part One: What is Kubernetes and how should you monitor it? Learn what Kubernetes is and what components you’ll need for complete observability.
How to Monitor Kubernetes, Part Two: How to optimize Kubernetes resource configurations for cost and performance. Configure your Kubernetes clusters to ensure availability, performance, and resilience.
Support tip of the week: Know when there is an alert failure
Alerts are only helpful when you receive the corresponding notification. There are a number of reasons a notification can fail to make it to the recipient, and now New Relic gives you the ability to investigate these issues and alert on them. Read this post to find out how.
What’s new at New Relic
Learn more about these new features and the rest of our latest releases by checking out What's new.
Join the New Relic Slack community to continue the conversation with hundreds of other developers using New Relic. 🌎
Not an existing New Relic user? Sign up for a free account to get started! 👨💻

Oldest comments (0)