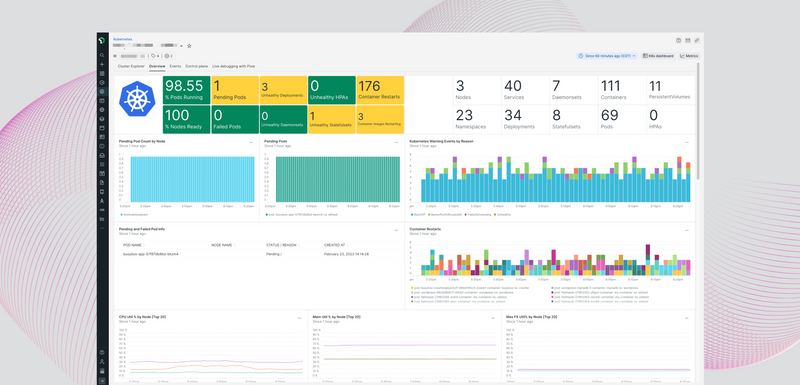
Correlate cluster and workload performance in one place with the new K8s dashboard
Quickly see Kubernetes (K8s) cluster resource utilization, such as CPU and memory; drill into specific nodes to correlate application state with the underlying infrastructure; and analyze container restarts and warning events.
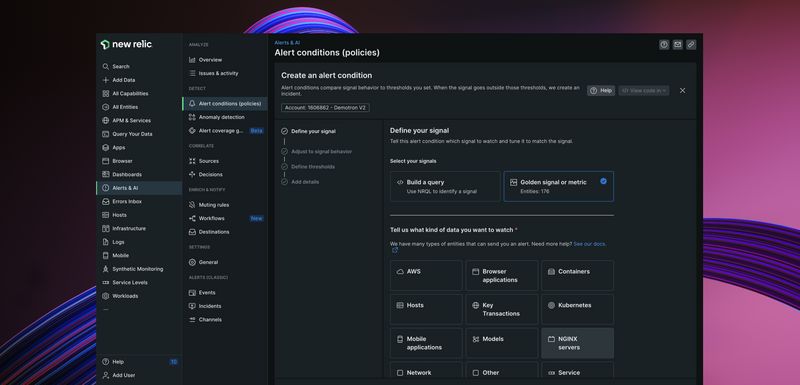
Streamline alert configuration and management
Our new guided point-and-click alert configuration flow makes it simple to create alert rules—even if you don’t know NRQL—for greater flexibility and context during setup.
Learn More
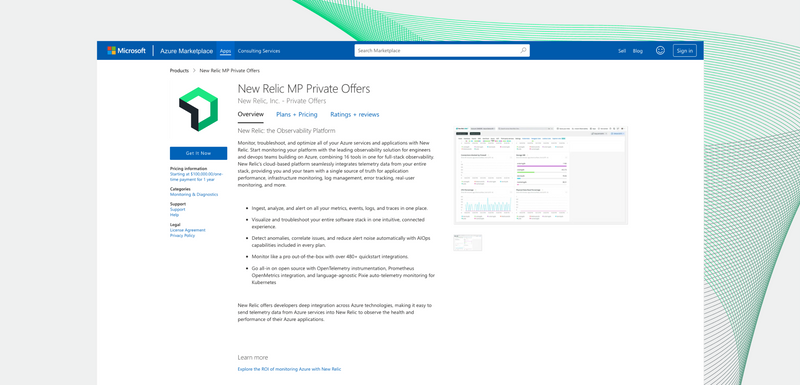
New Relic private offers now available in Azure Marketplace
Private offers featuring custom pricing, terms, and conditions are now available in Azure Marketplace. This offering lets you store telemetry data in Azure and apply 100% of your New Relic spend towards your Microsoft Azure Consumption Commitment (MACC). Existing customers: please contact your account team for details.
Learn More
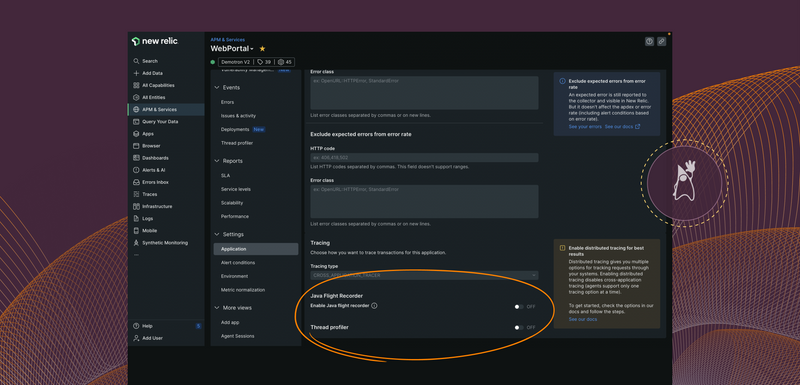
Enable real-time Java profiling on the fly
Identify performance bottlenecks and get real-time data about Java virtual machine (JVM) resources, CPU, and garbage collection with the New Relic real-time Java profiling tool. Now you can dynamically enable real-time profiling by toggling the Java Flight Recorder (JFR) configuration in the user interface without restarting the application.
Learn More

Using regular expressions to extract data from your logs
Build a robust rule to get key-value pairs from log lines. Learn how to use regular expressions (regex) and Grok to extract key-value pairs from your logs. Read More
Automate configuration with observability as code series
Parts two and three of our observability as code series are now available! This series offers a guide to automate the configuration of observability tools effectively with New Relic and Terraform. Learn to create dashboards, alerts, synthetic monitoring, tags, and workloads as code with video tutorials and examples. Read More
Mature observability practice insights from the 2022 Observability Forecast
The definition of a mature observability practice may vary, but adhering to industry best practices and achieving specific outcomes should be the starting point. Explore how organizations are utilizing observability to maintain a competitive edge in today's fast-paced digital environment. Read More

New Relic: Hack for Good
Join us for free at our San Francisco HQ on April 27 where you’ll connect and work with other engineers to hack for good! Build a project that helps our planet and win up to $1,000, plus some exclusive New Relic swag. Register Now
Weekly Webinars: Get Started with New Relic
Join us each week for our series of public webinars. Whether you’re just discovering observability, you’re a new user on the platform, or you simply have questions, we have a session for you. Register Now
Not an existing New Relic user? Sign up for a free account to get started! 👨💻

Oldest comments (0)