loki && grafana
in my previously written articles i explained what loki is and how we can setup loki via docker-compose.
finally: some GUI
this time we add a grafana instance to our docker-compsose stack to talk to our loki instance. and finally we get some fancy user interface.
lets add a grafana instance to our docker-compose stack and provide a loki datasource during startup.
First provide a datasource definition in the folder you've located the docker-compose file:
$ mkdir -p grafana-provision/datasources
$ cat <<EOF >>grafana-provision/datasources/auto.yaml
apiVersion: 1

datasources:
  - name: Loki
    type: loki
    access: proxy
    url: http://loki:3100
    jsonData:
      maxLines: 1000
EOF
enhance the compose stack with an additional instance:
(...)
  grafana:
    image: "grafana/grafana:8.5.3"
    depends_on:
      - loki
    ports:
      - "3000:3000"
    volumes:
      - ./grafana-provision:/etc/grafana/provisioning
access loki
upon starting the compose stack you should now have a working datasource in the configuration/datasources panel and should be able to find a datasource "loki" in the dropdown in the explore mode. Navigate your browser to http://localhost:3000/datasources/
if you've freshly started the compose stack the explore feature is not quite useful as there is nothing to be explored.
add some data
remembering the commands from the previous article we create some data via curl:
$ curl -S -H "Content-Type: application/json" -XPOST -s http://localhost:3100/loki/api/v1/push --data-raw '{"streams": [{ "stream": { "app": "app1" }, "values": [ [ "1653937064000000000", "random log line" ] ] }]}'
$ curl -S -H "Content-Type: application/json" -XPOST -s http://localhost:3100/loki/api/v1/push --data-raw '{"streams": [{ "stream": { "app": "app2" }, "values": [ [ "1653937064000000000", "other random log line" ] ] }]}'
$ curl -S -H "Content-Type: application/json" -XPOST -s http://localhost:3100/loki/api/v1/push --data-raw '{"streams": [{ "stream": { "app": "app3" }, "values": [ [ "1653937064000000000", "another random log line" ] ] }]}'
hint: you might have to create a new timestamp via TIMESTAMP="date +%s000000000" echo ${TIMESTAMP}
browse logs
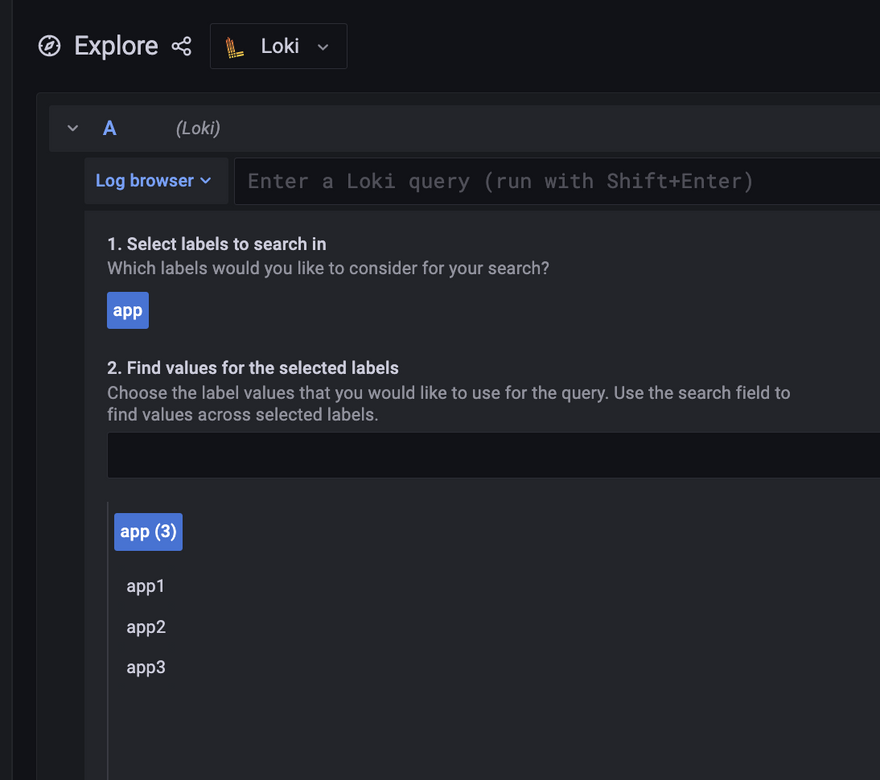
if you followed along you should now see the following selectable labels in your browser:
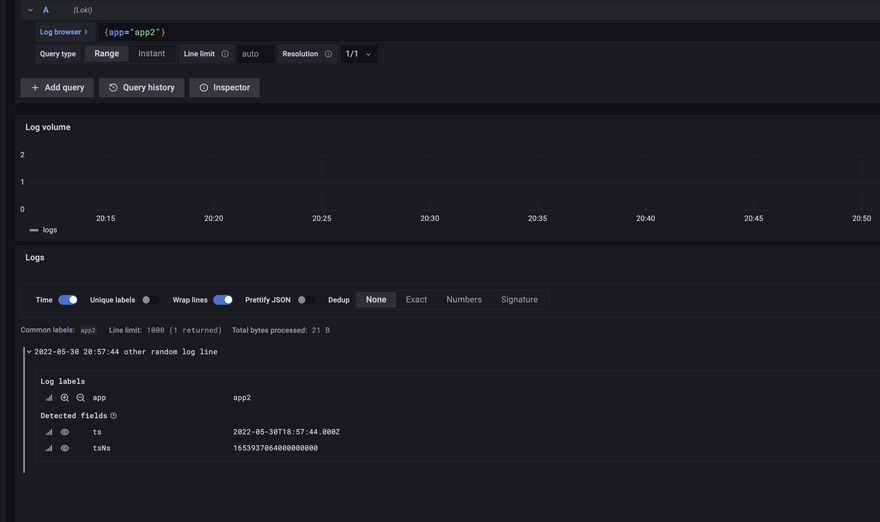
select one label value and hit "show logs" and you should see the previously injected log events.
closing thoughts
thats it basically. in the upcoming post we select a log shipper that speaks with loki. after that we have a look on LogQl, the query language that you've now already used a little bit.
complete compose-stack
---
version: "3.9"

services:
  loki:
    image: "grafana/loki:2.5.0"
    ports:
      - "3100:3100"
  logcli:
    image: "grafana/logcli:2.5.0-amd64"
    environment:
      - "LOKI_ADDR=http://loki:3100"
  grafana:
    image: "grafana/grafana:8.5.3"
    depends_on:
      - loki
    ports:
      - "3000:3000"
    volumes:
      - ./grafana-provision:/etc/grafana/provisioning


Top comments (0)